Page History
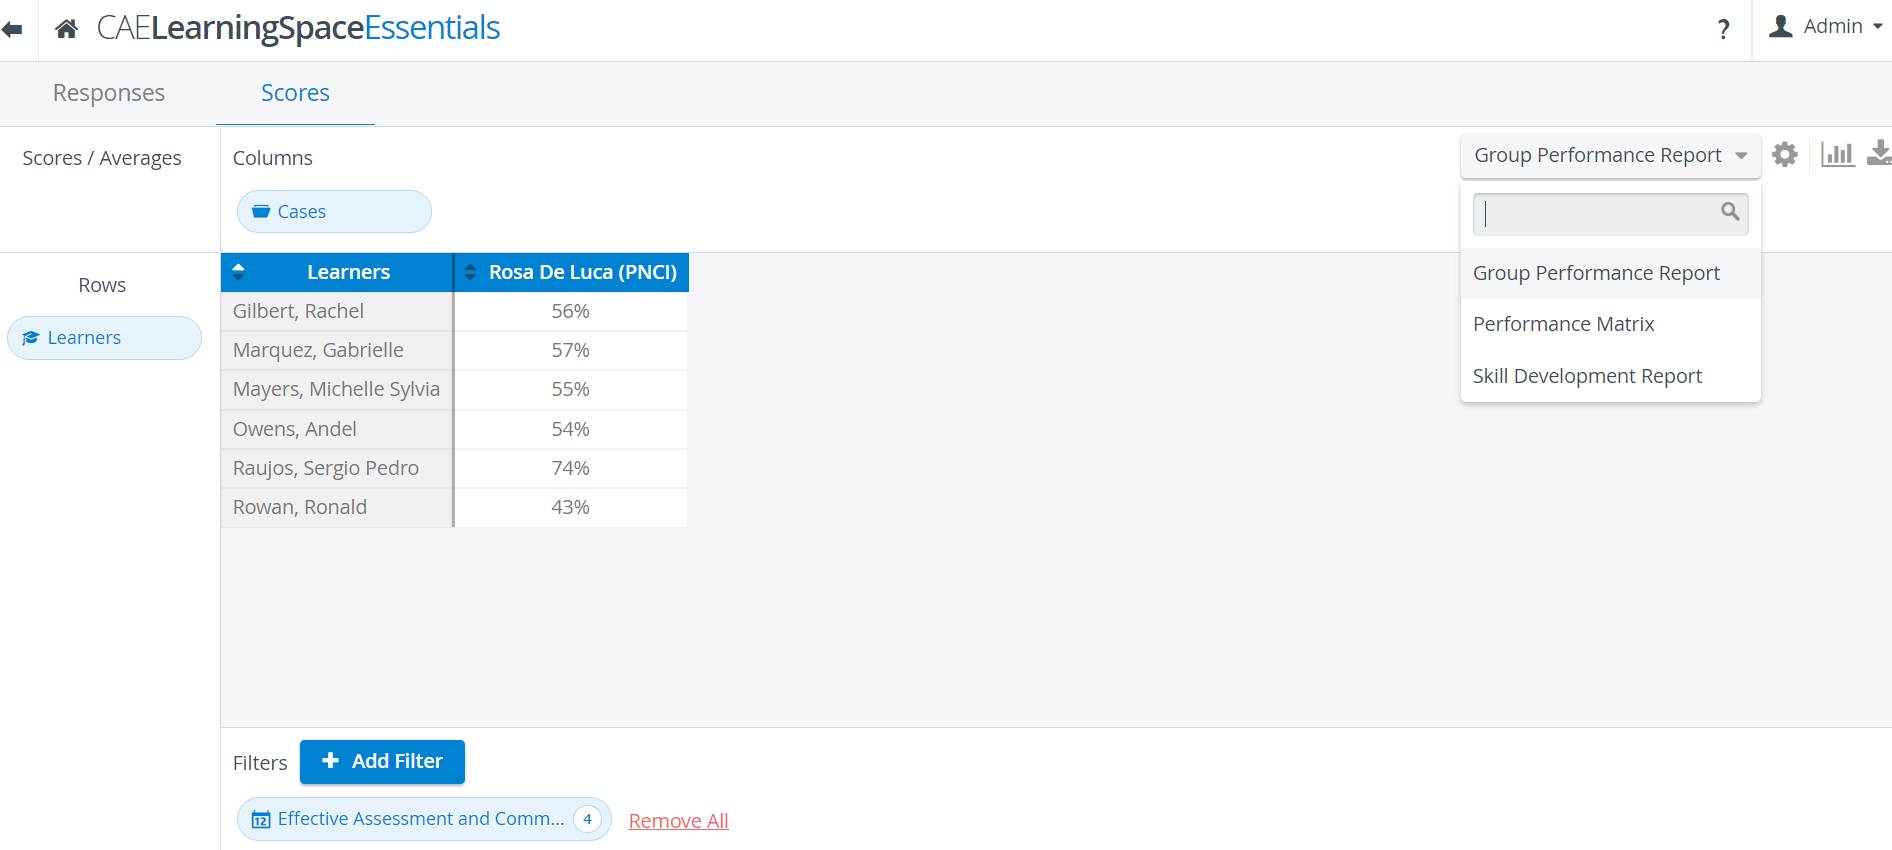
On the Scores tab, three preset (system-set) reports can be retrieved, to be selected via the drop-down in the top right corner of the screen:
- Group Performance Report
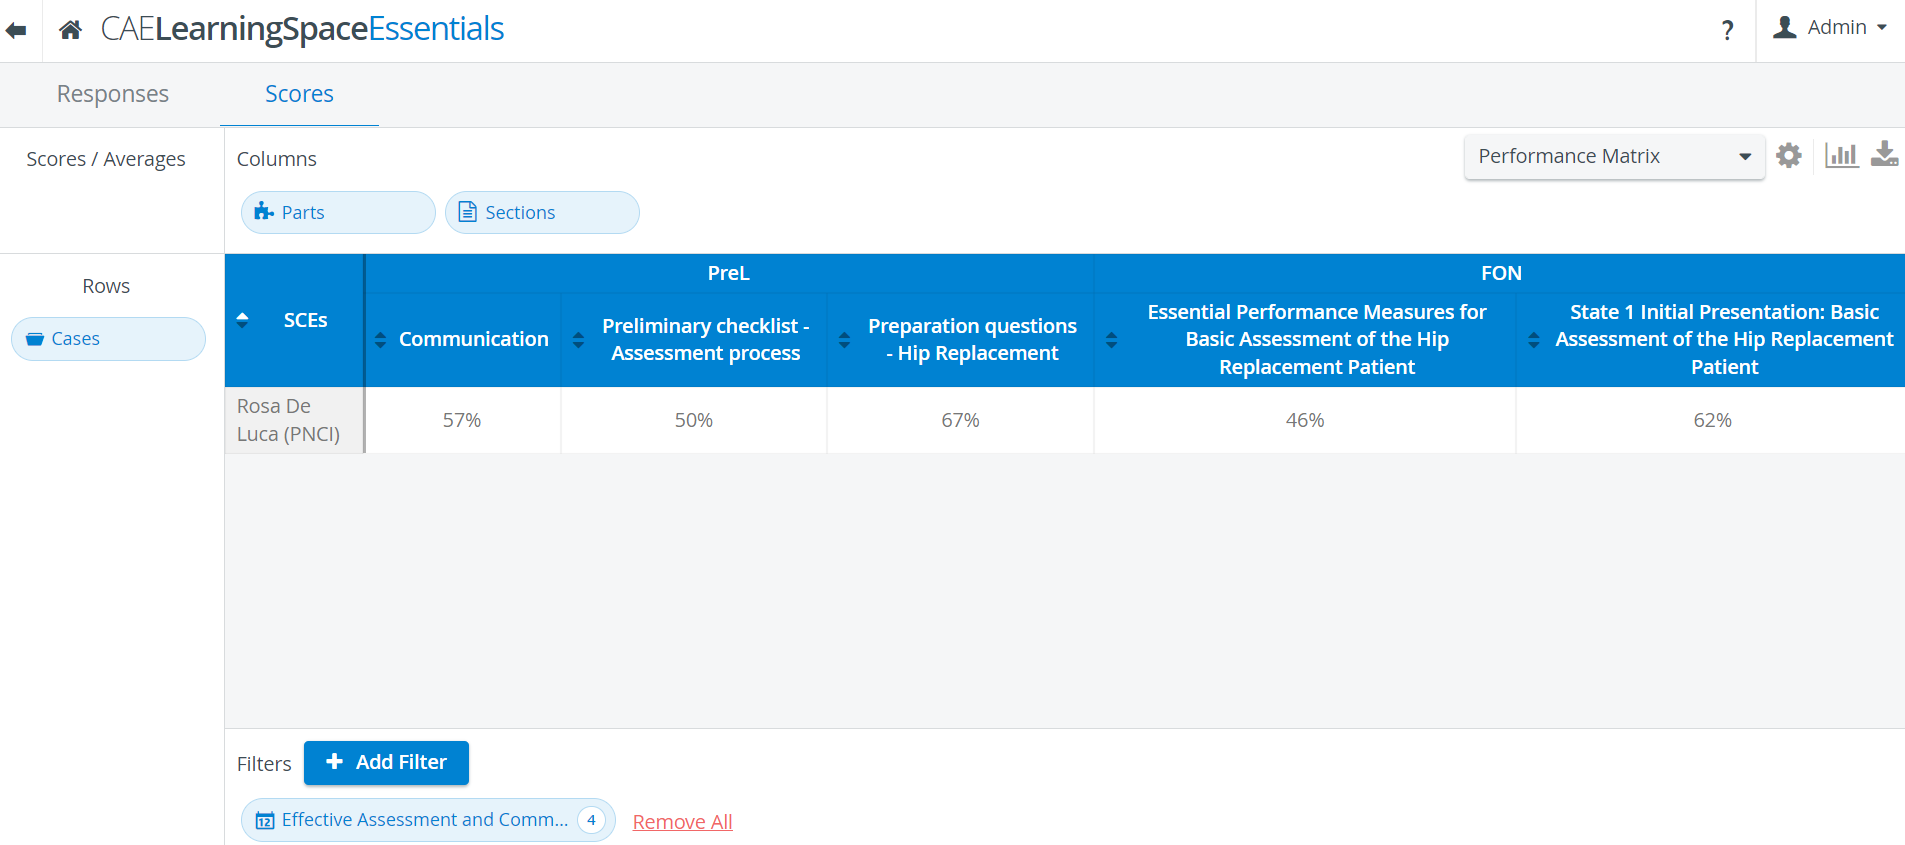
- Performance Matrix
- Skill Development Report
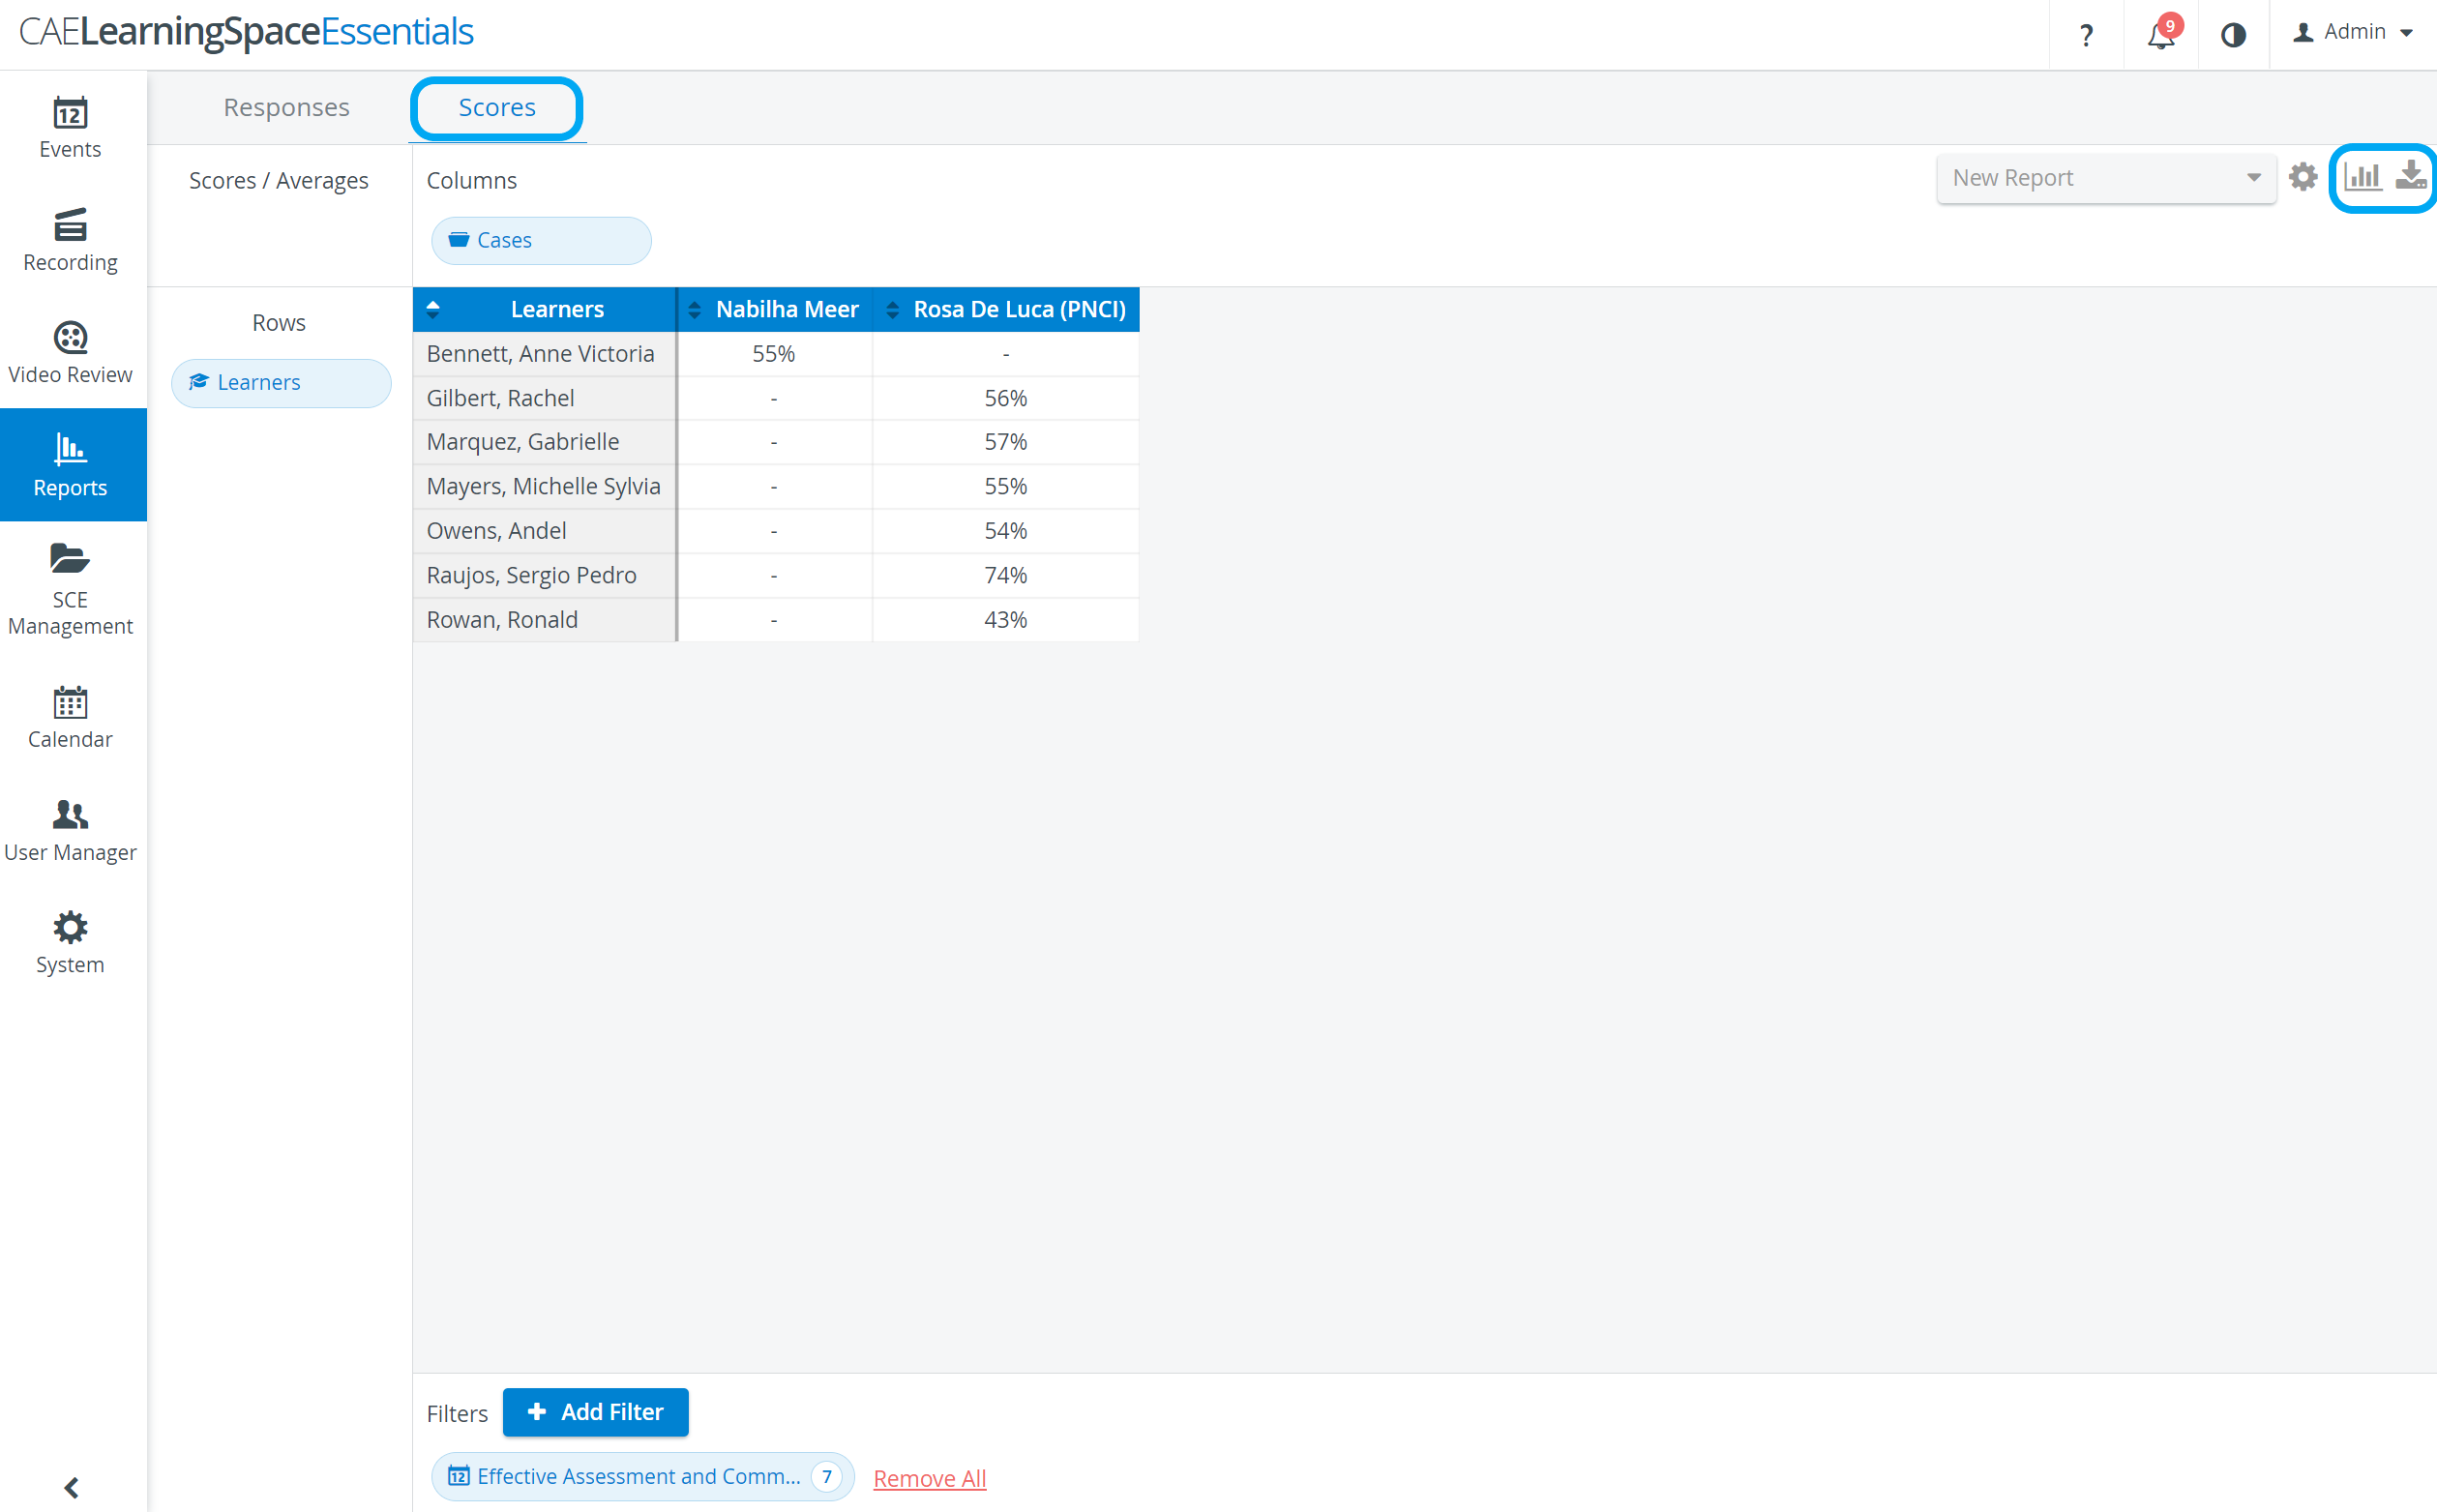
The queried report can then be displayed in a chart format (and printed) or saved as an excel file by clicking the graph ![]() or download data
or download data ![]() icons next to the report-selector and the Scores setting cogwheel
icons next to the report-selector and the Scores setting cogwheel ![]() respectively.
respectively.
| Note |
|---|
| Activities via the Add Filter button. |
| Note |
|---|
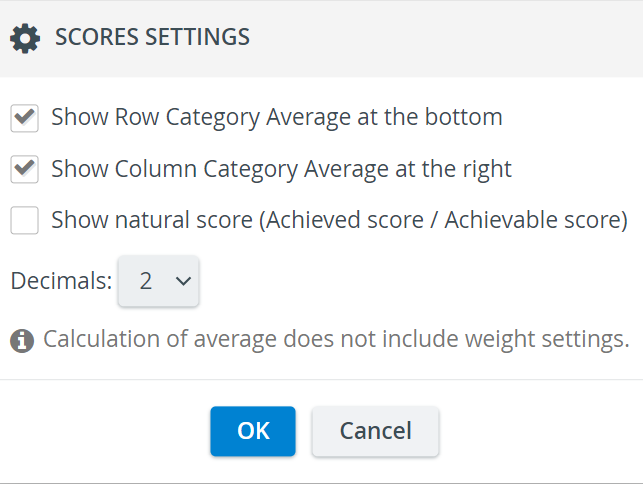
TIP: Row or Column Category Average can be added by clicking the cogwheel in the top right corner of the tab and ticking the desired box in the prompted Score Settings pop-up.
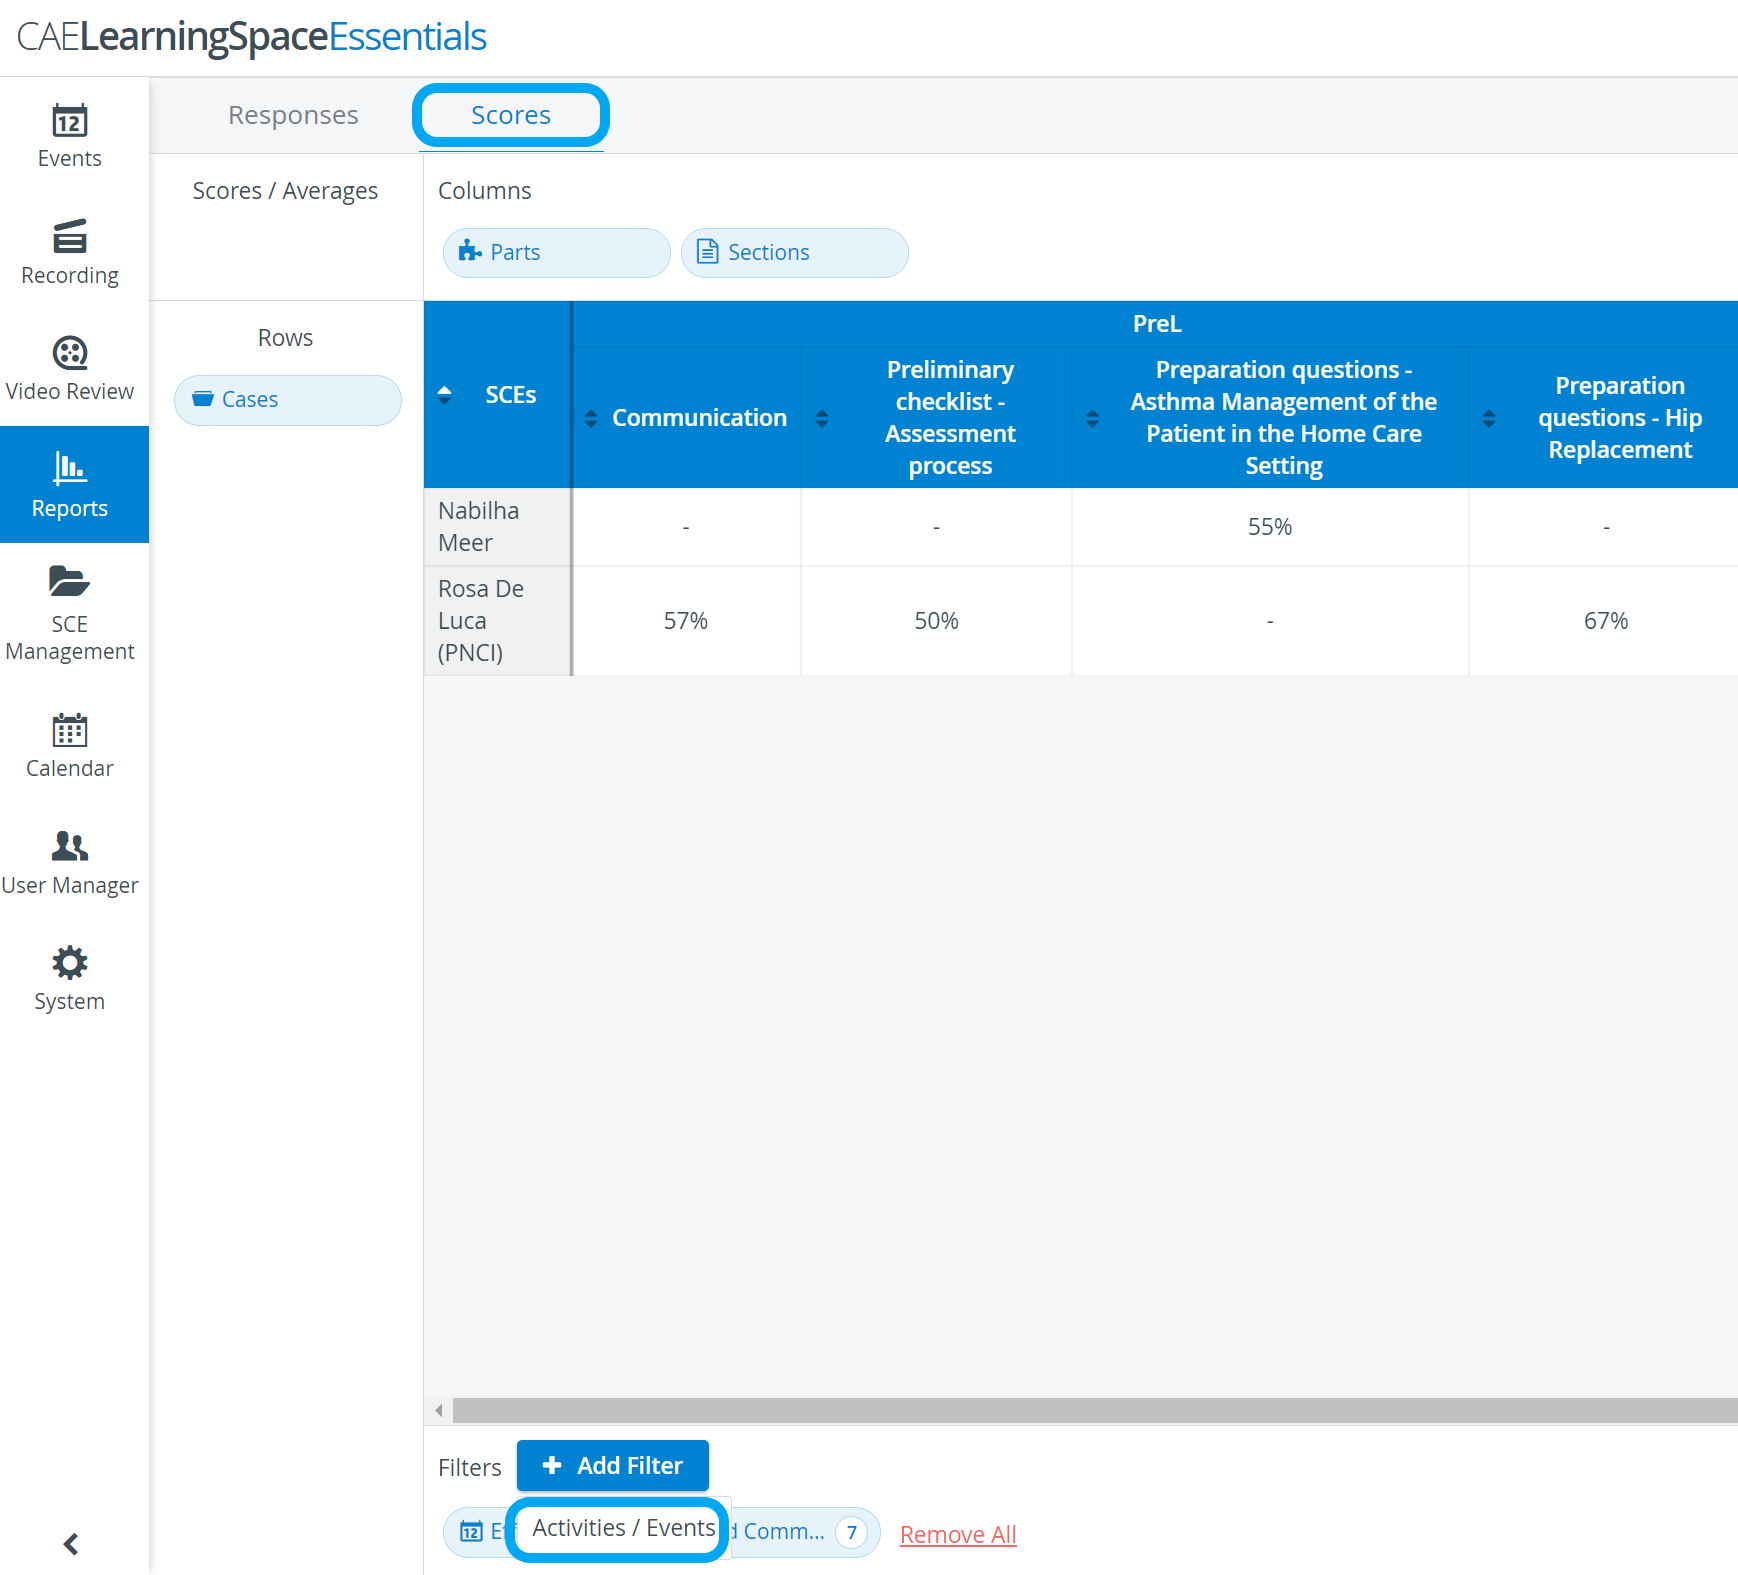
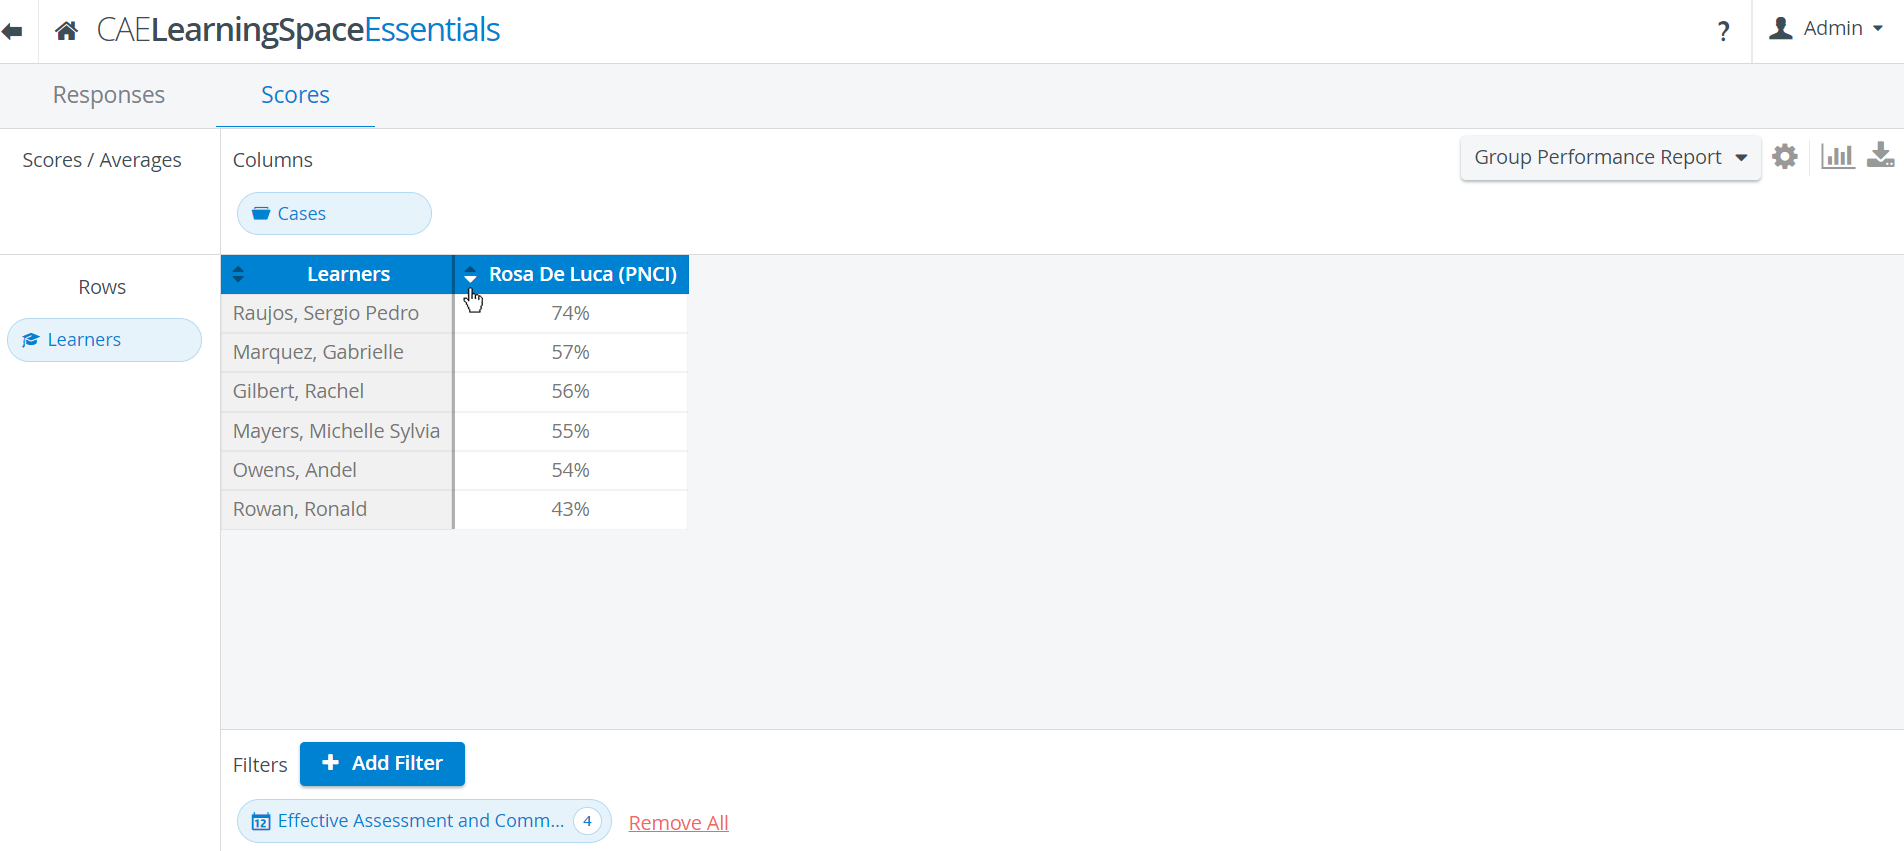
TIP:| Click the arrow in any SCE header to have the results displayed according to learner results in that specific SCE. |
SCEs are listed in rows, and columns correspond to the different sections within a checklist, grouped by checklist.
Skill Development Report
This report reflects on the learners' performance in the different skill areas.
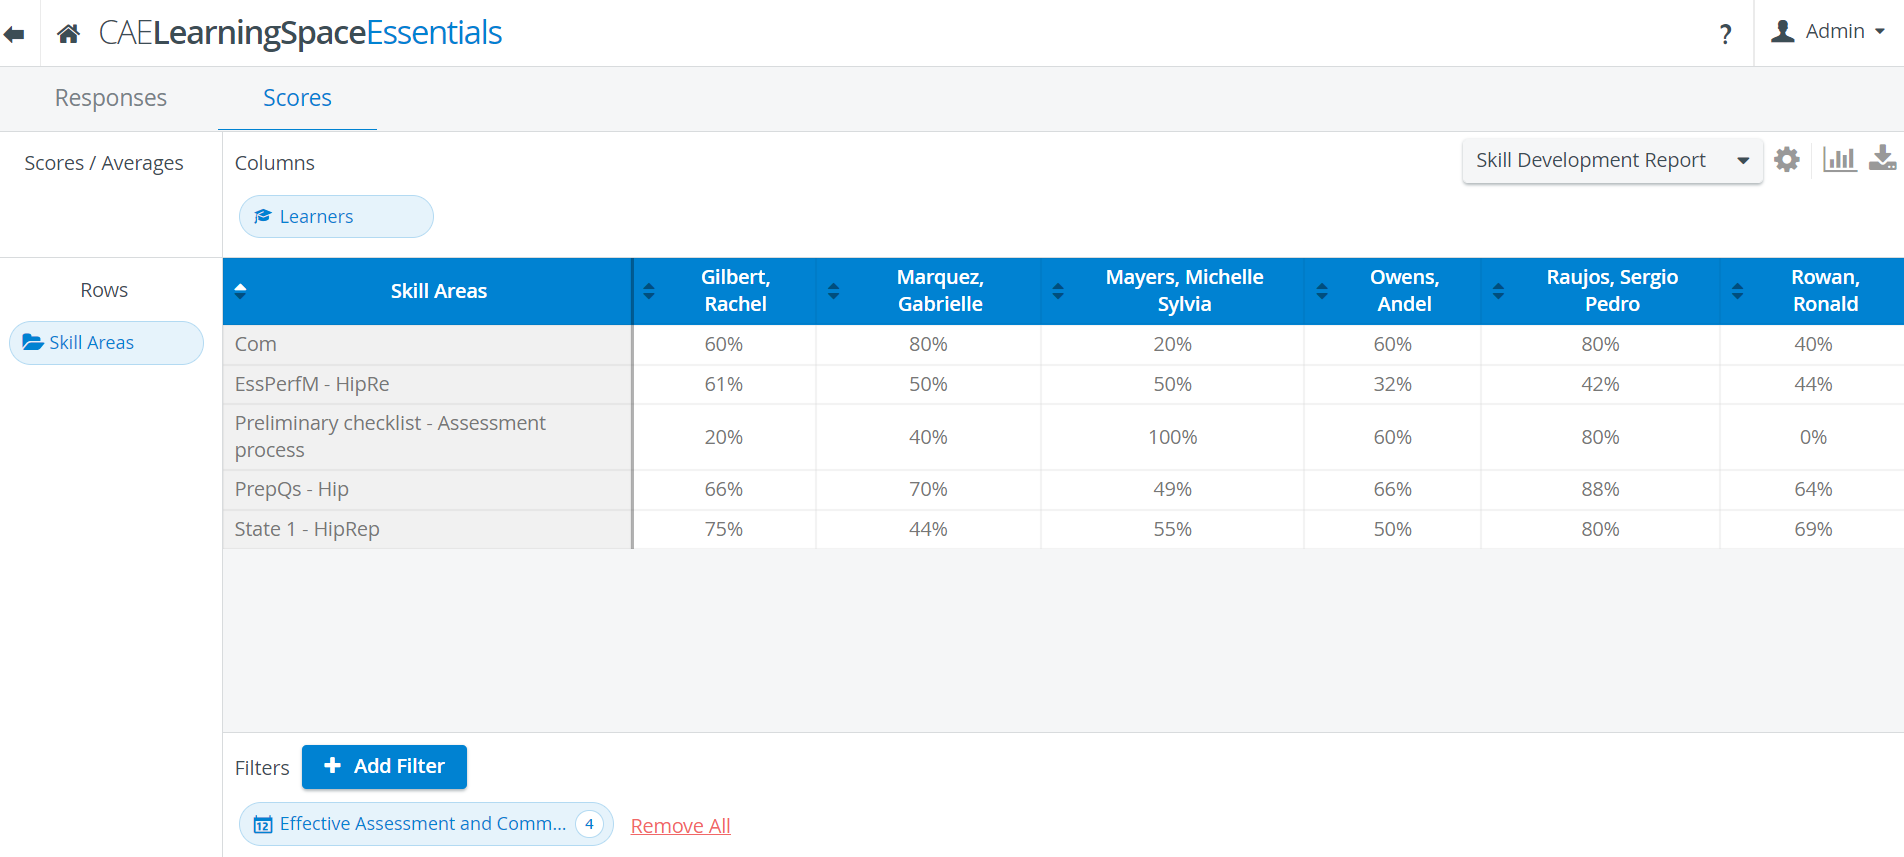
Skill areas are determined by the section abbreviations created within a checklist. Sections consist of items
| As skill areas are specified for sections and one can be used for several different sets of questions through several different SCEs, it follows that Skill Development Report does not reflect on learners' performance within an event or SCE, but rather their overall performance within the realm of a certain skill determined by questions linked to that skill. |
Scores Settings 
- Decimals
| Tip |
|---|
Chart display 
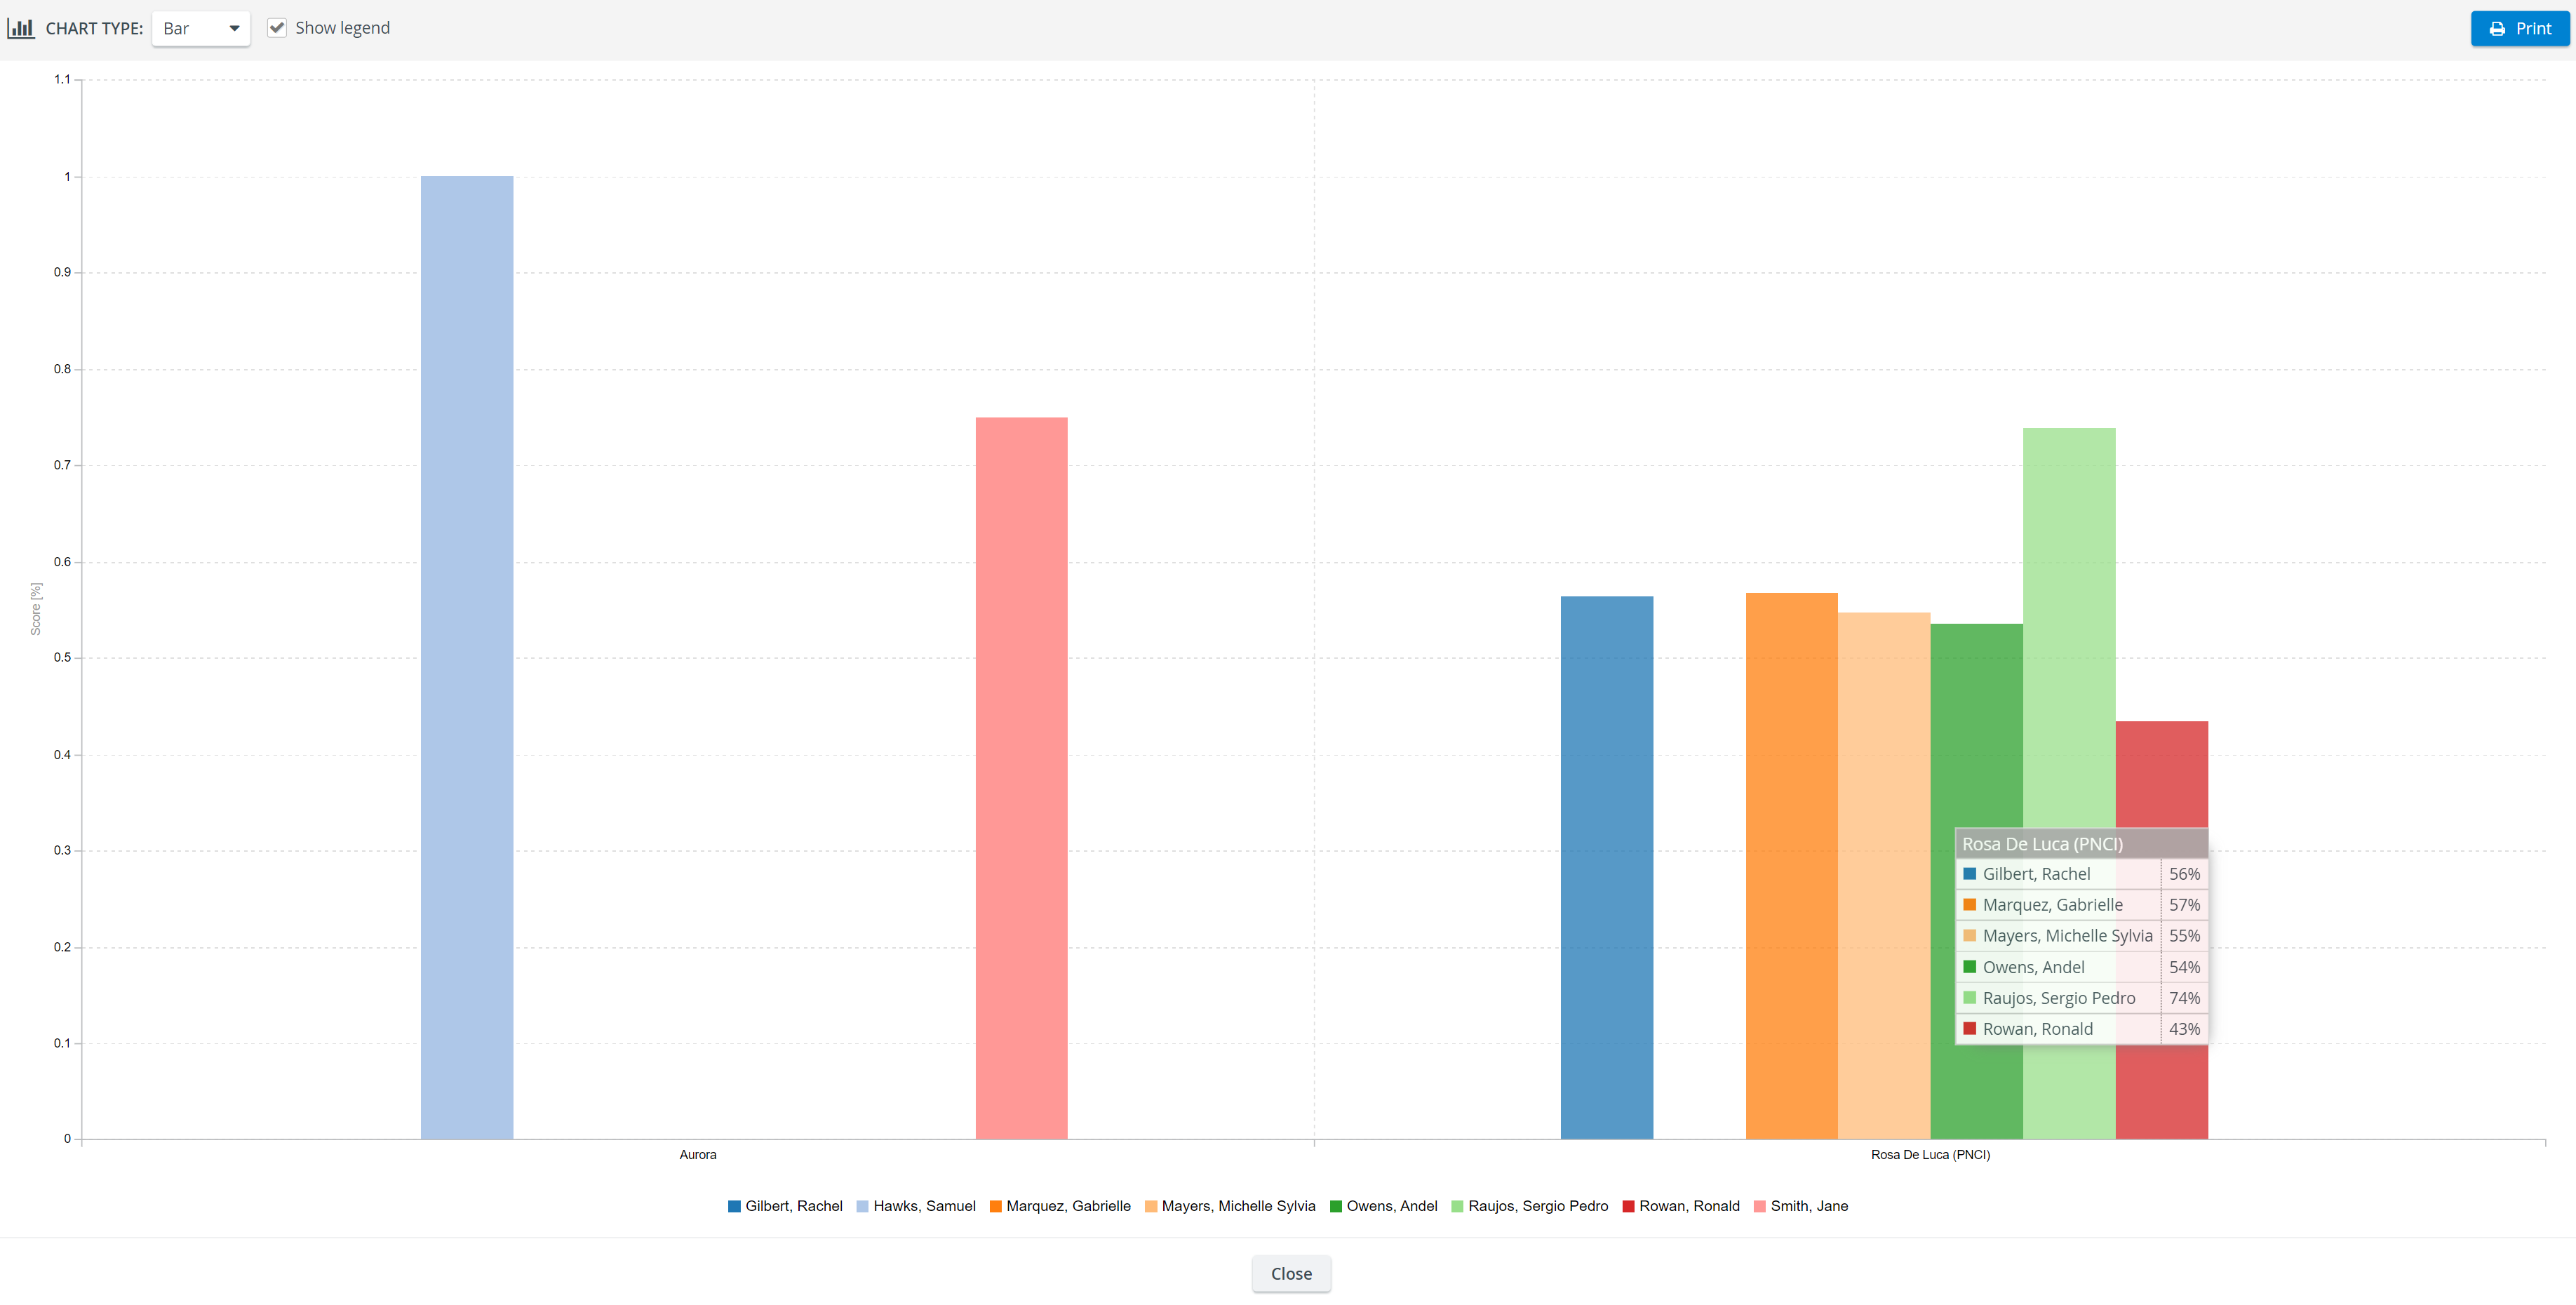
Reports can be displayed in Bar, Line, Spline and Scatter chart formats, and be printed by using the Print button.
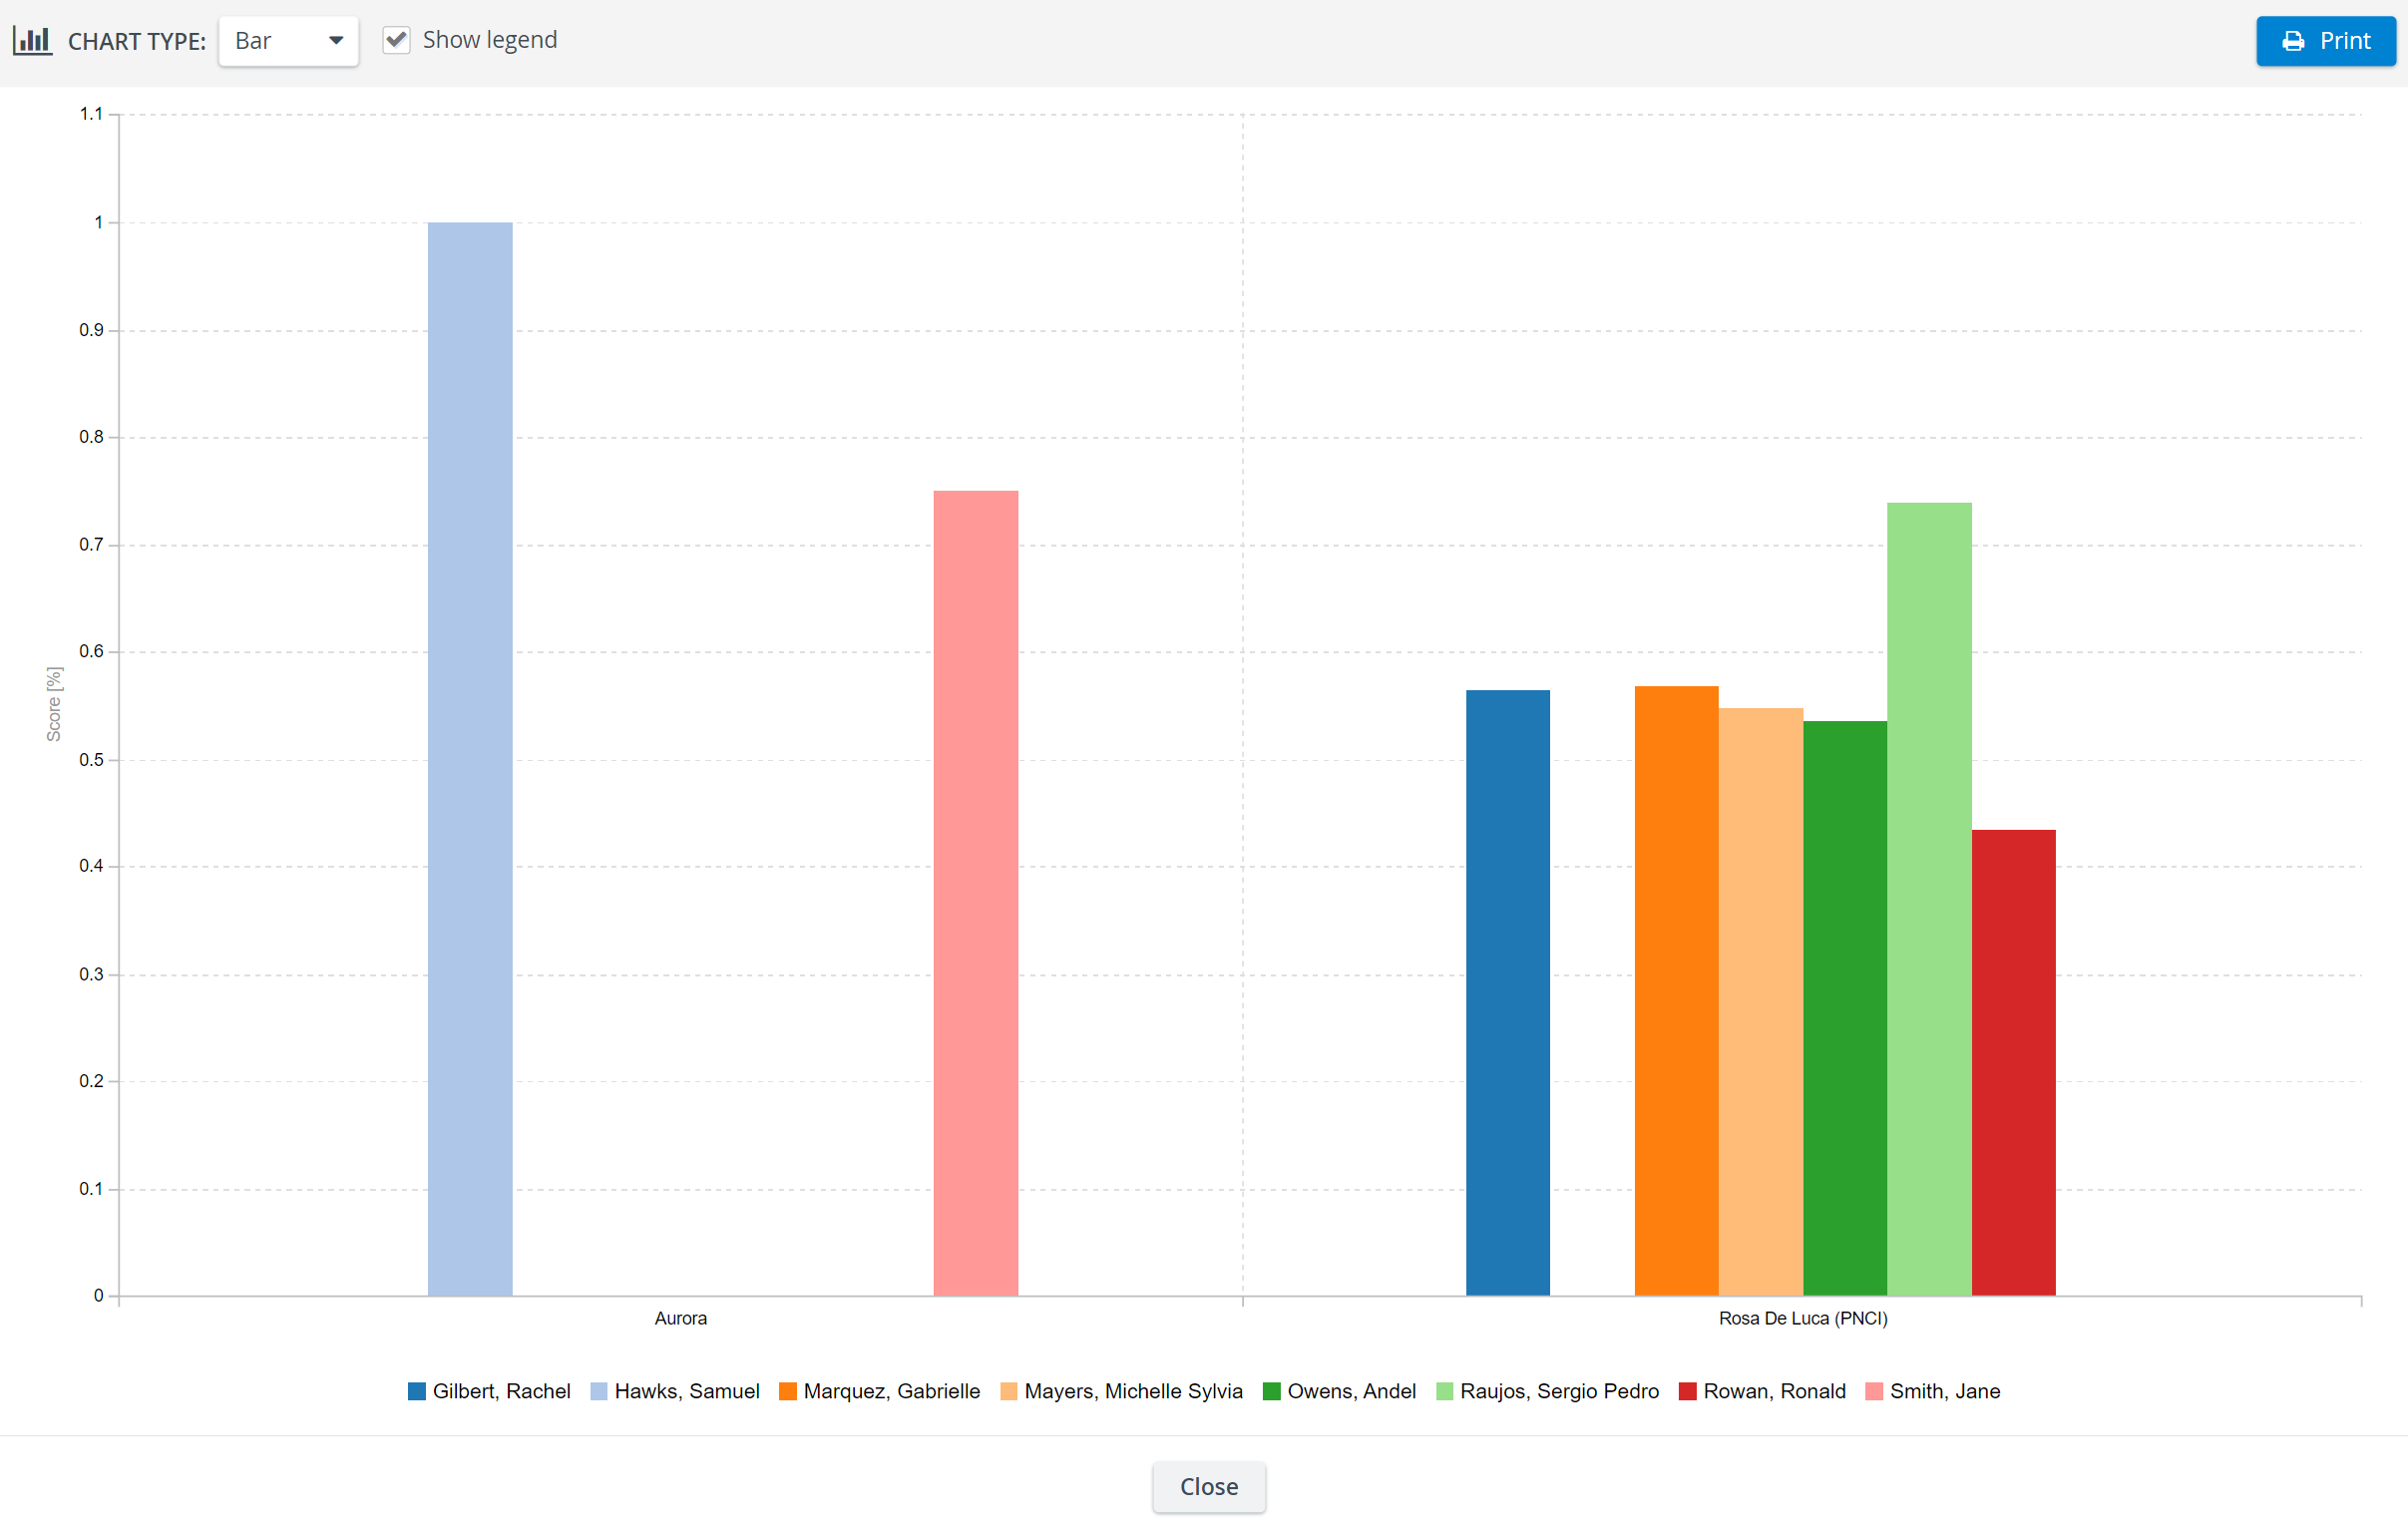
Show legend option
With this option enabled (next to the Chart Type drop-down menu), further information can be displayed by hovering over the different parts of the chart. Learner names along with scores (in percentages) are displayed in accordance with the bar colors.
| Info |
|---|
For more information, visit ourReports Module and Reports - FAQ helpsite pages. |
Overview
Content Tools