Page History
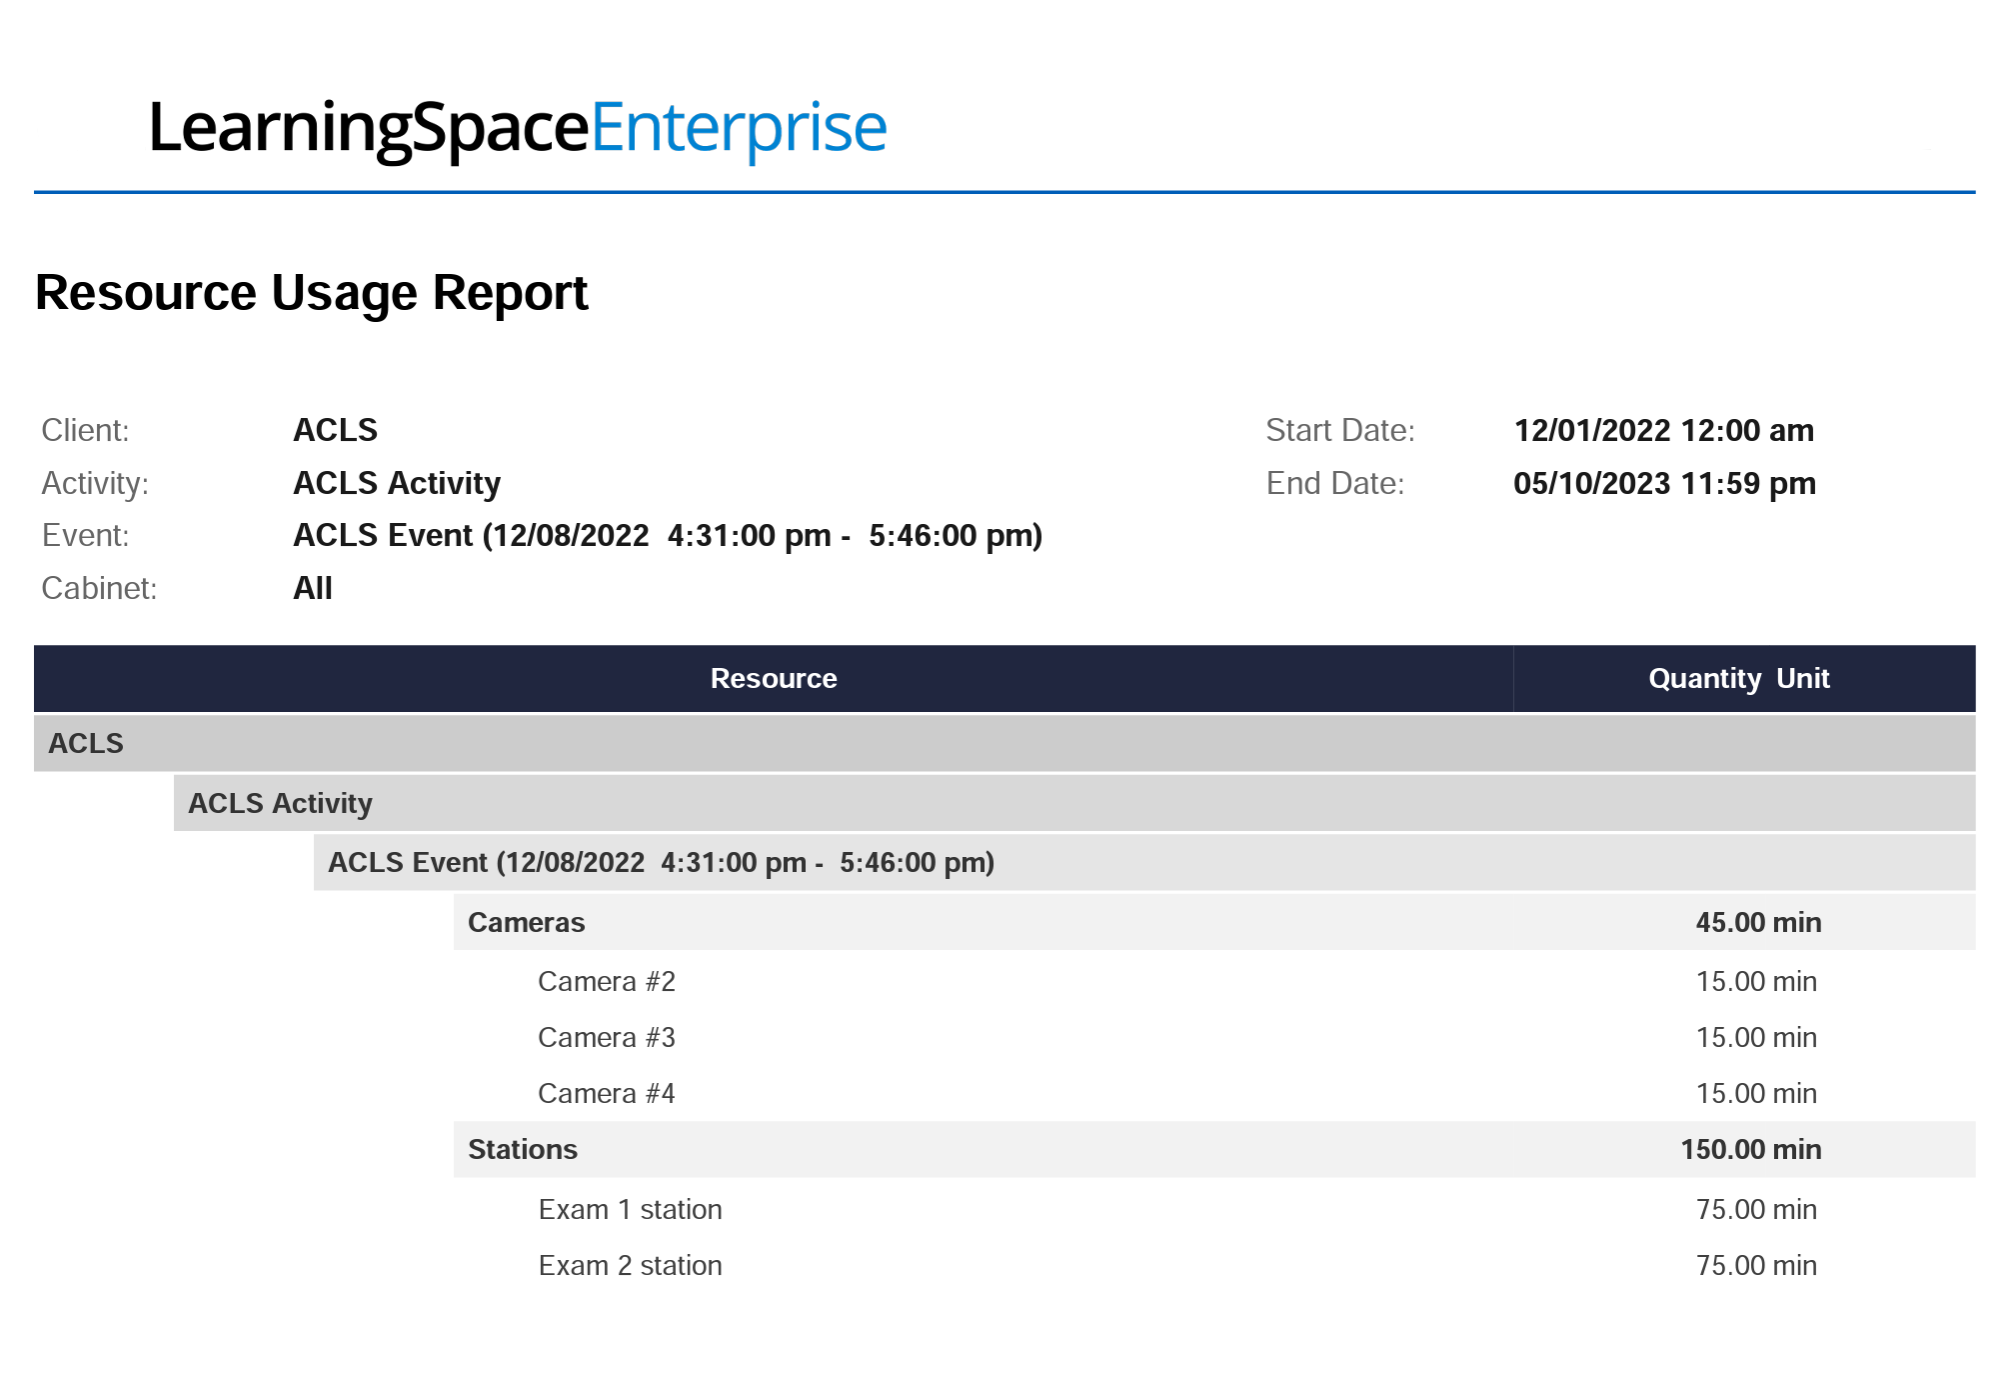
Resource Usage Report
Generate a report containing the overall usage data of a particular client, activity or event broken down by resource categories or even into individual resources.
You can also select cabinets to only display the resource usages that belong to certain categories.
| Tip |
|---|
To print Resource Usage reports that include the usage data of individual resources within each category, select the Breakdown to Resources checkbox. |

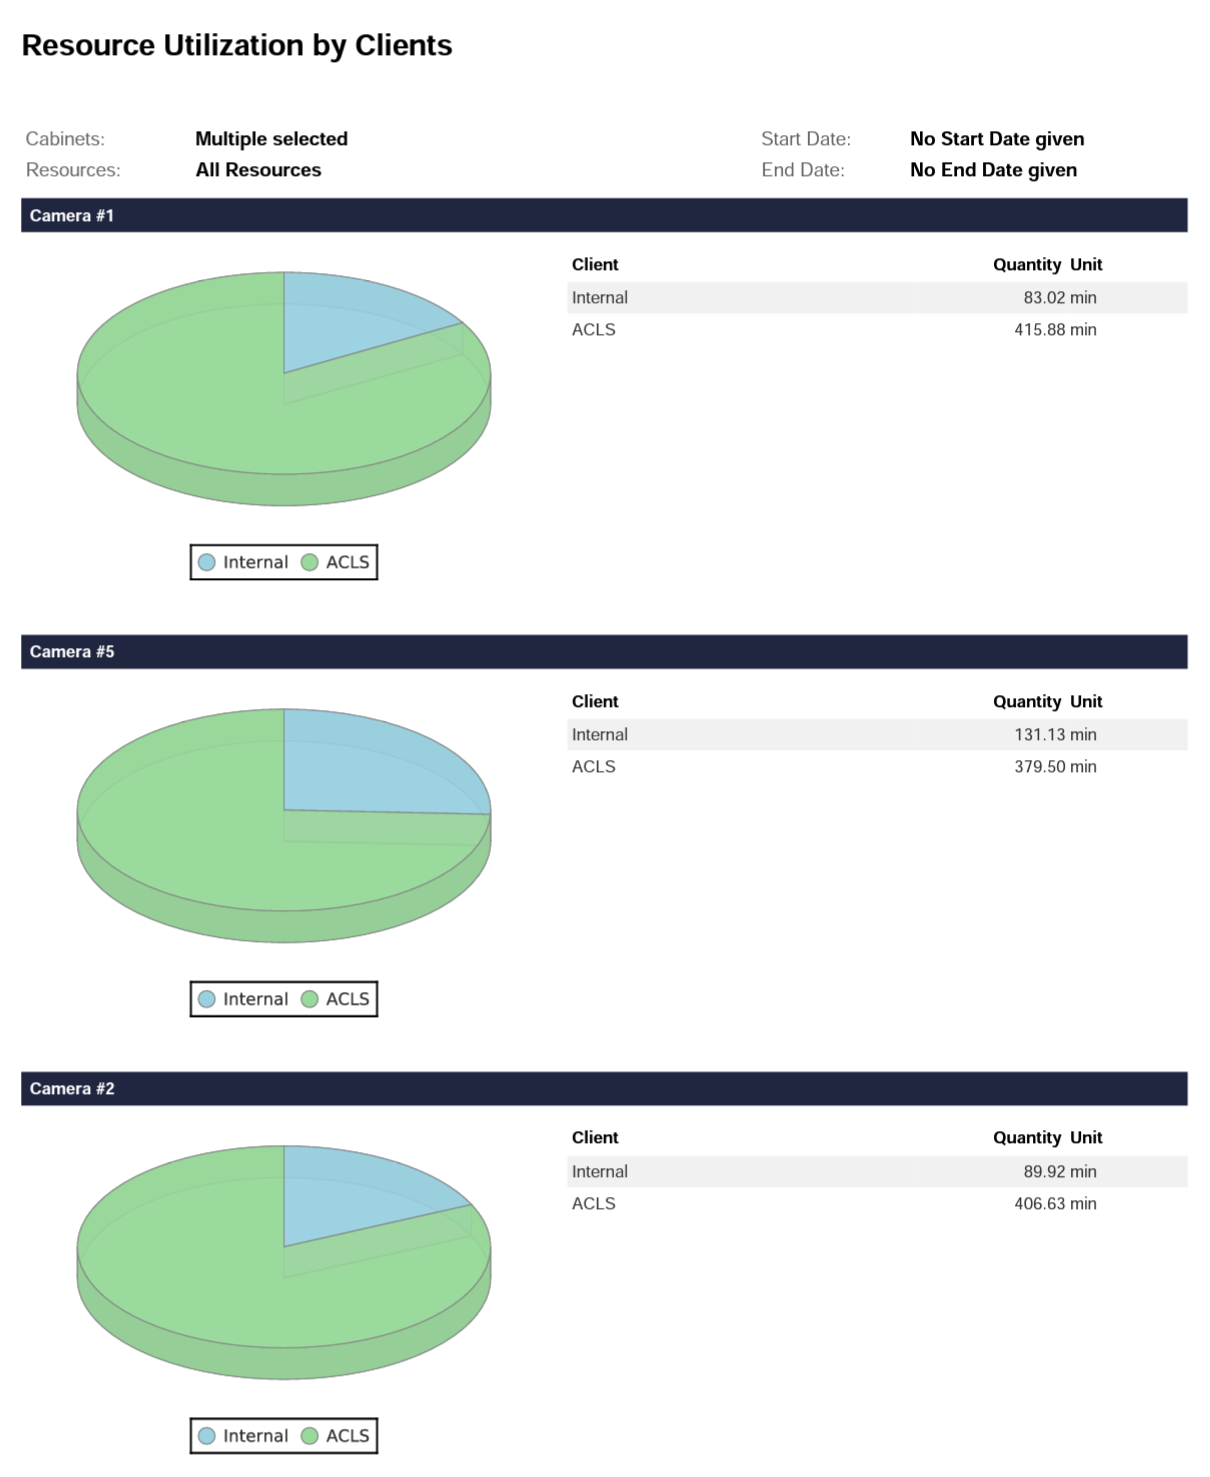
Resource Utilization Report
You can visualize to what extent each client used particular resources. The report will list every resource one by one indicating each client and the percentage of usage per client.
You can include every resource added to the system on one report or filter by category or the name of the resources.
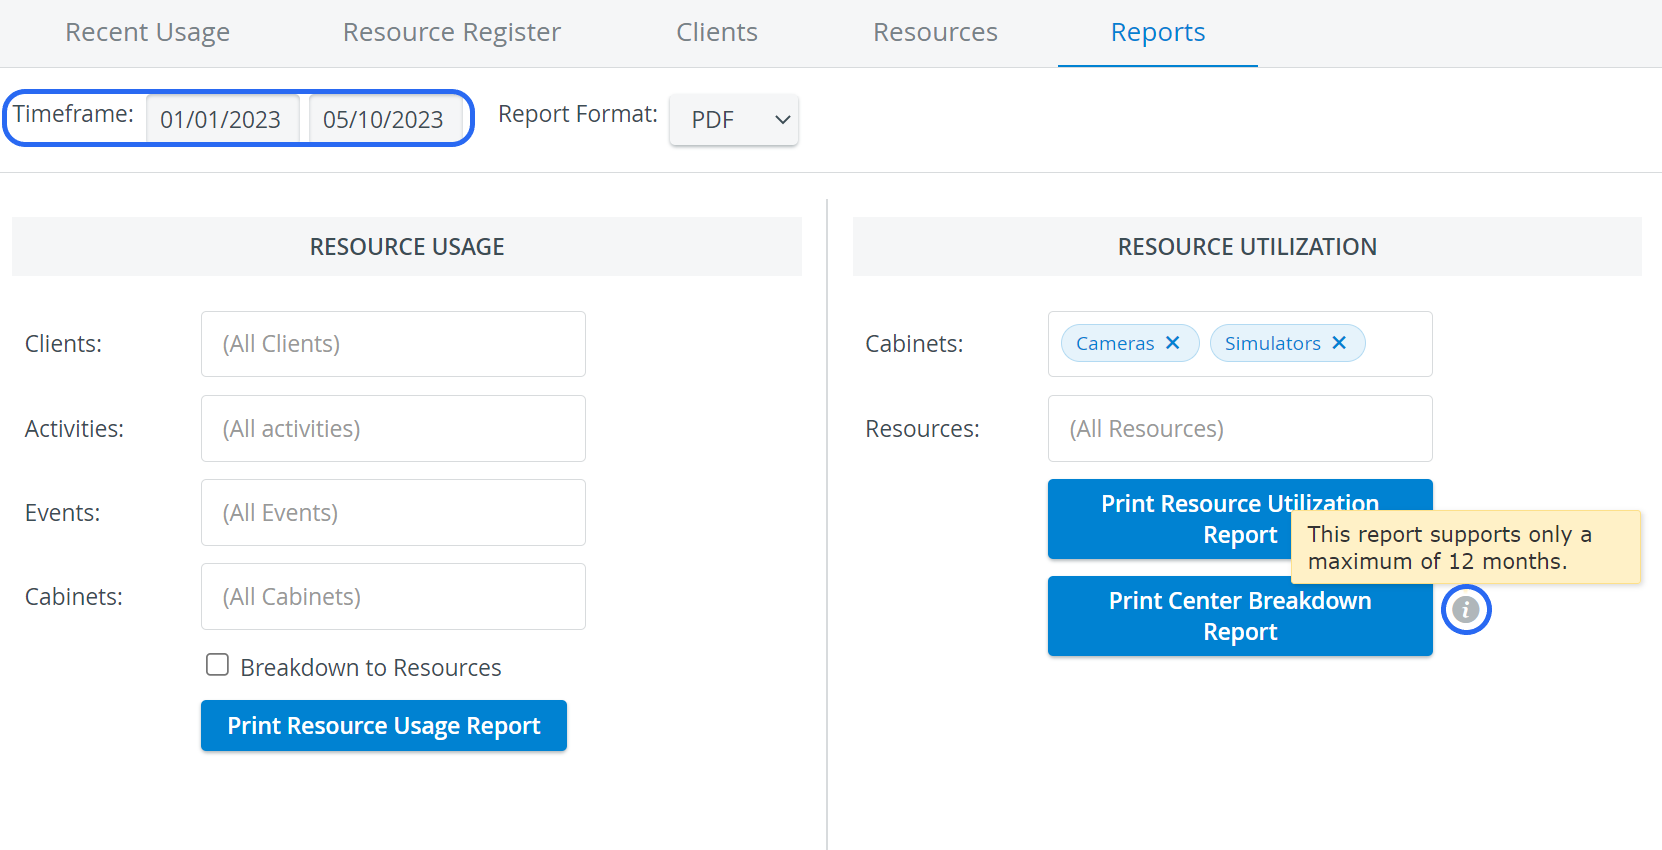
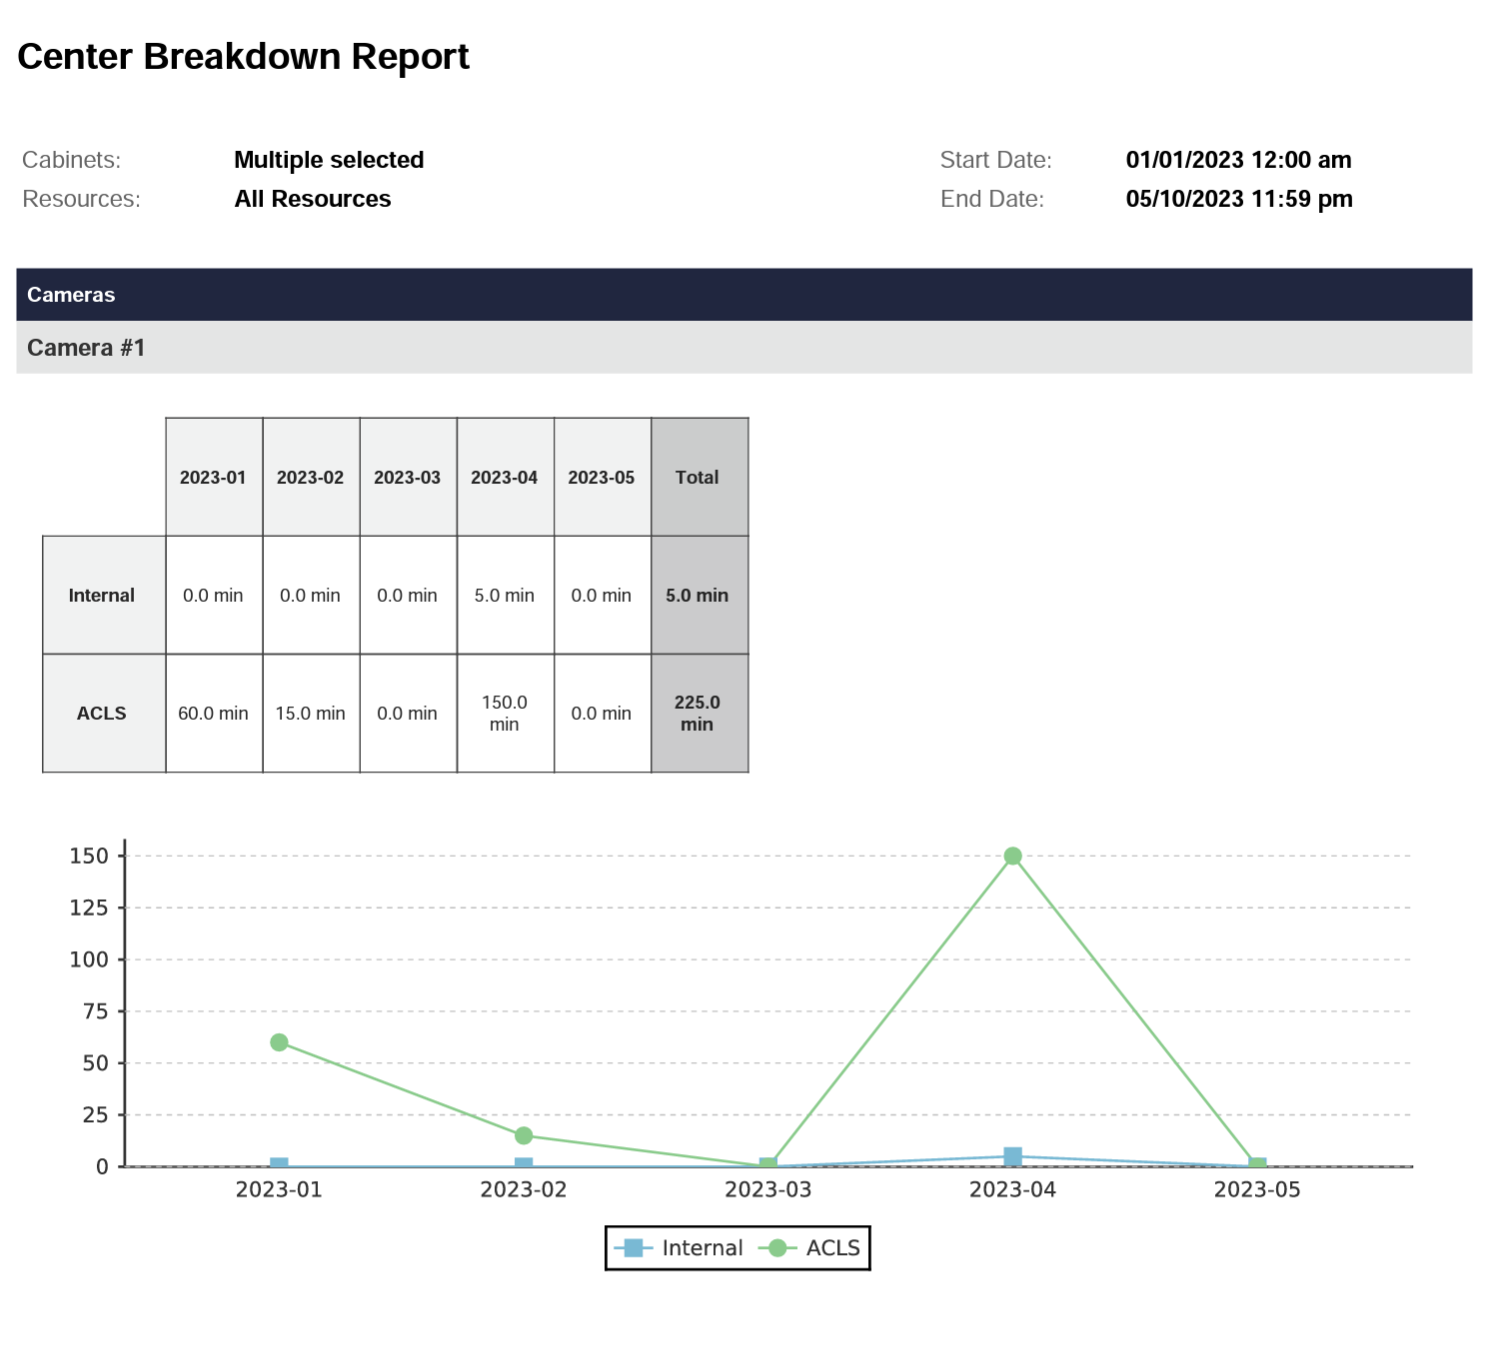
Center Breakdown Report
The report visualizes how the amount of usage of individual resources changes from month to month, broken down by clients over a period of time.
| Note | ||
|---|---|---|
| ||
The Center Breakdown Report can only gather the results of the last 12 months. |


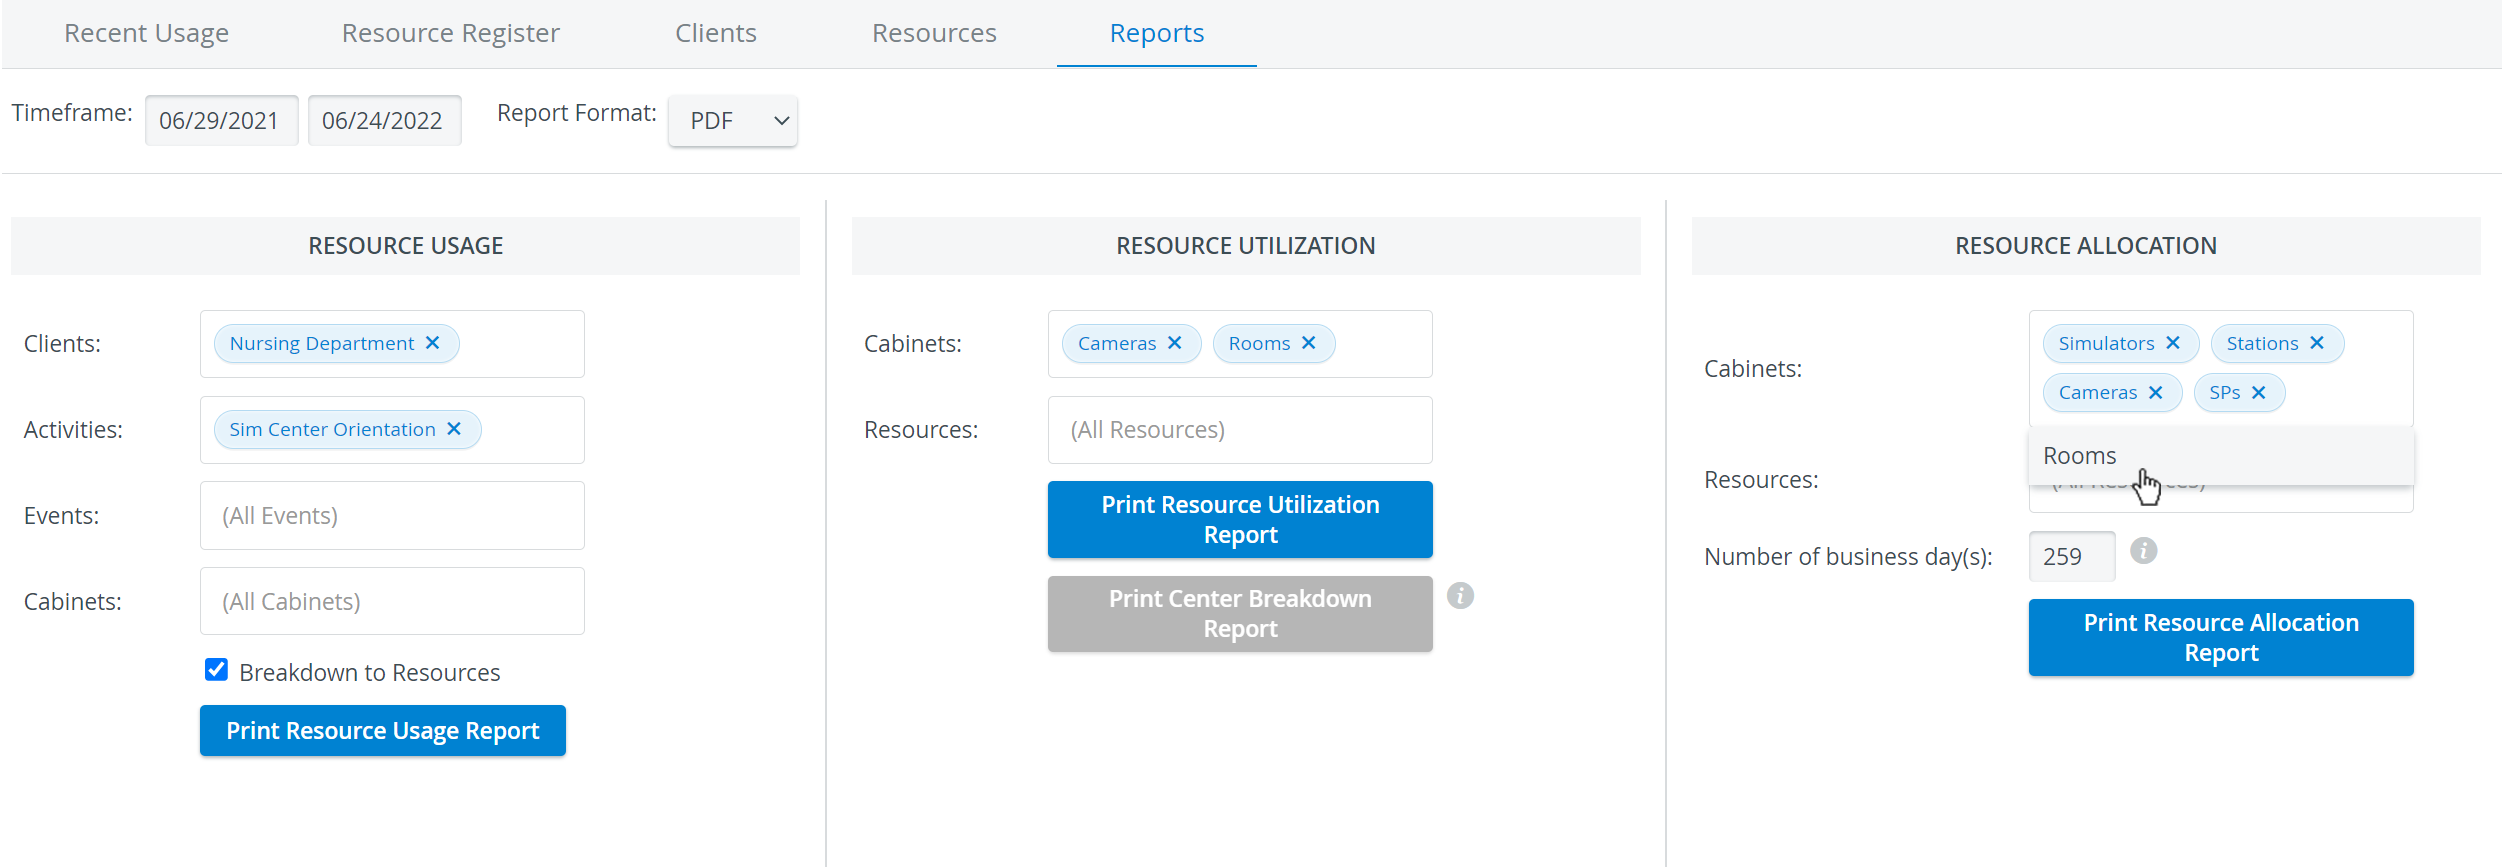
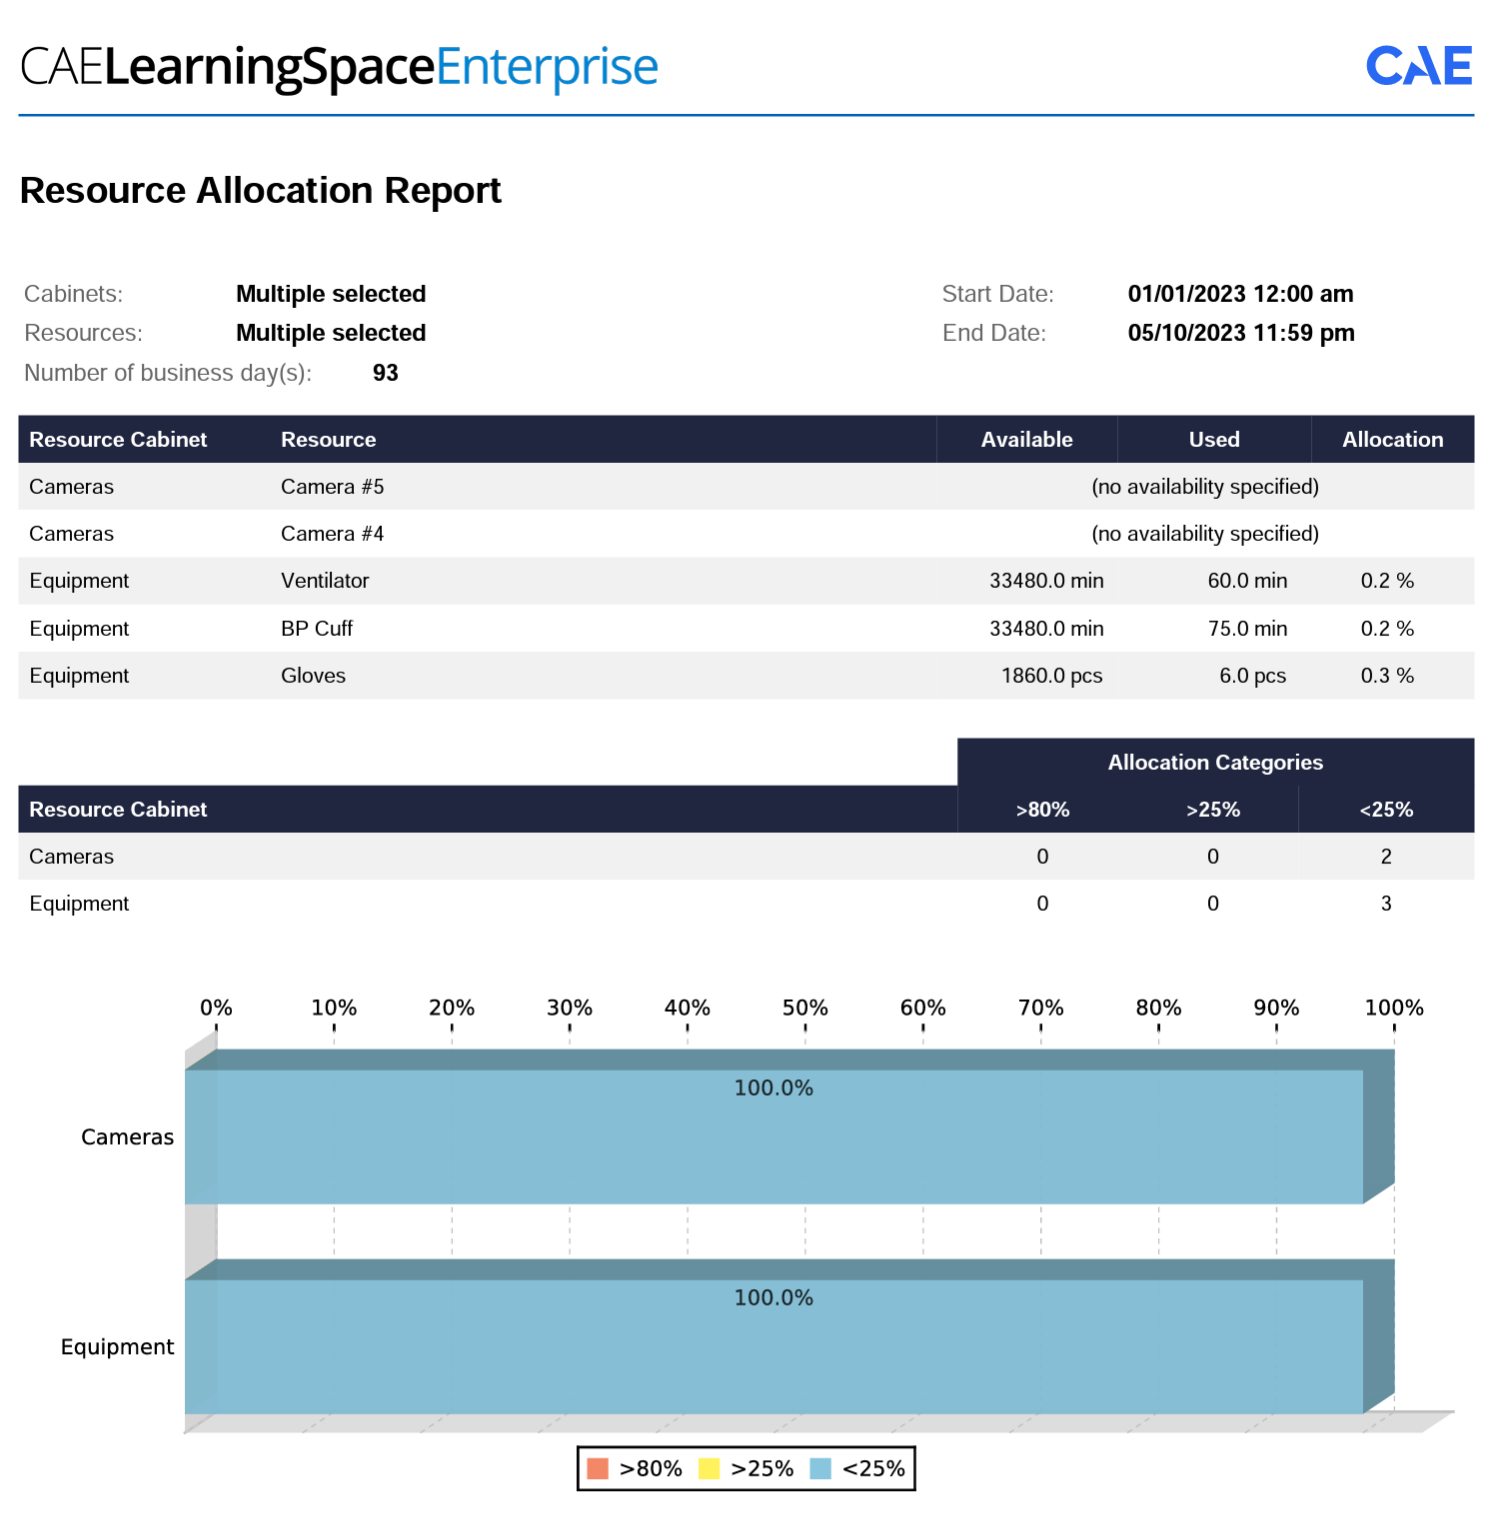
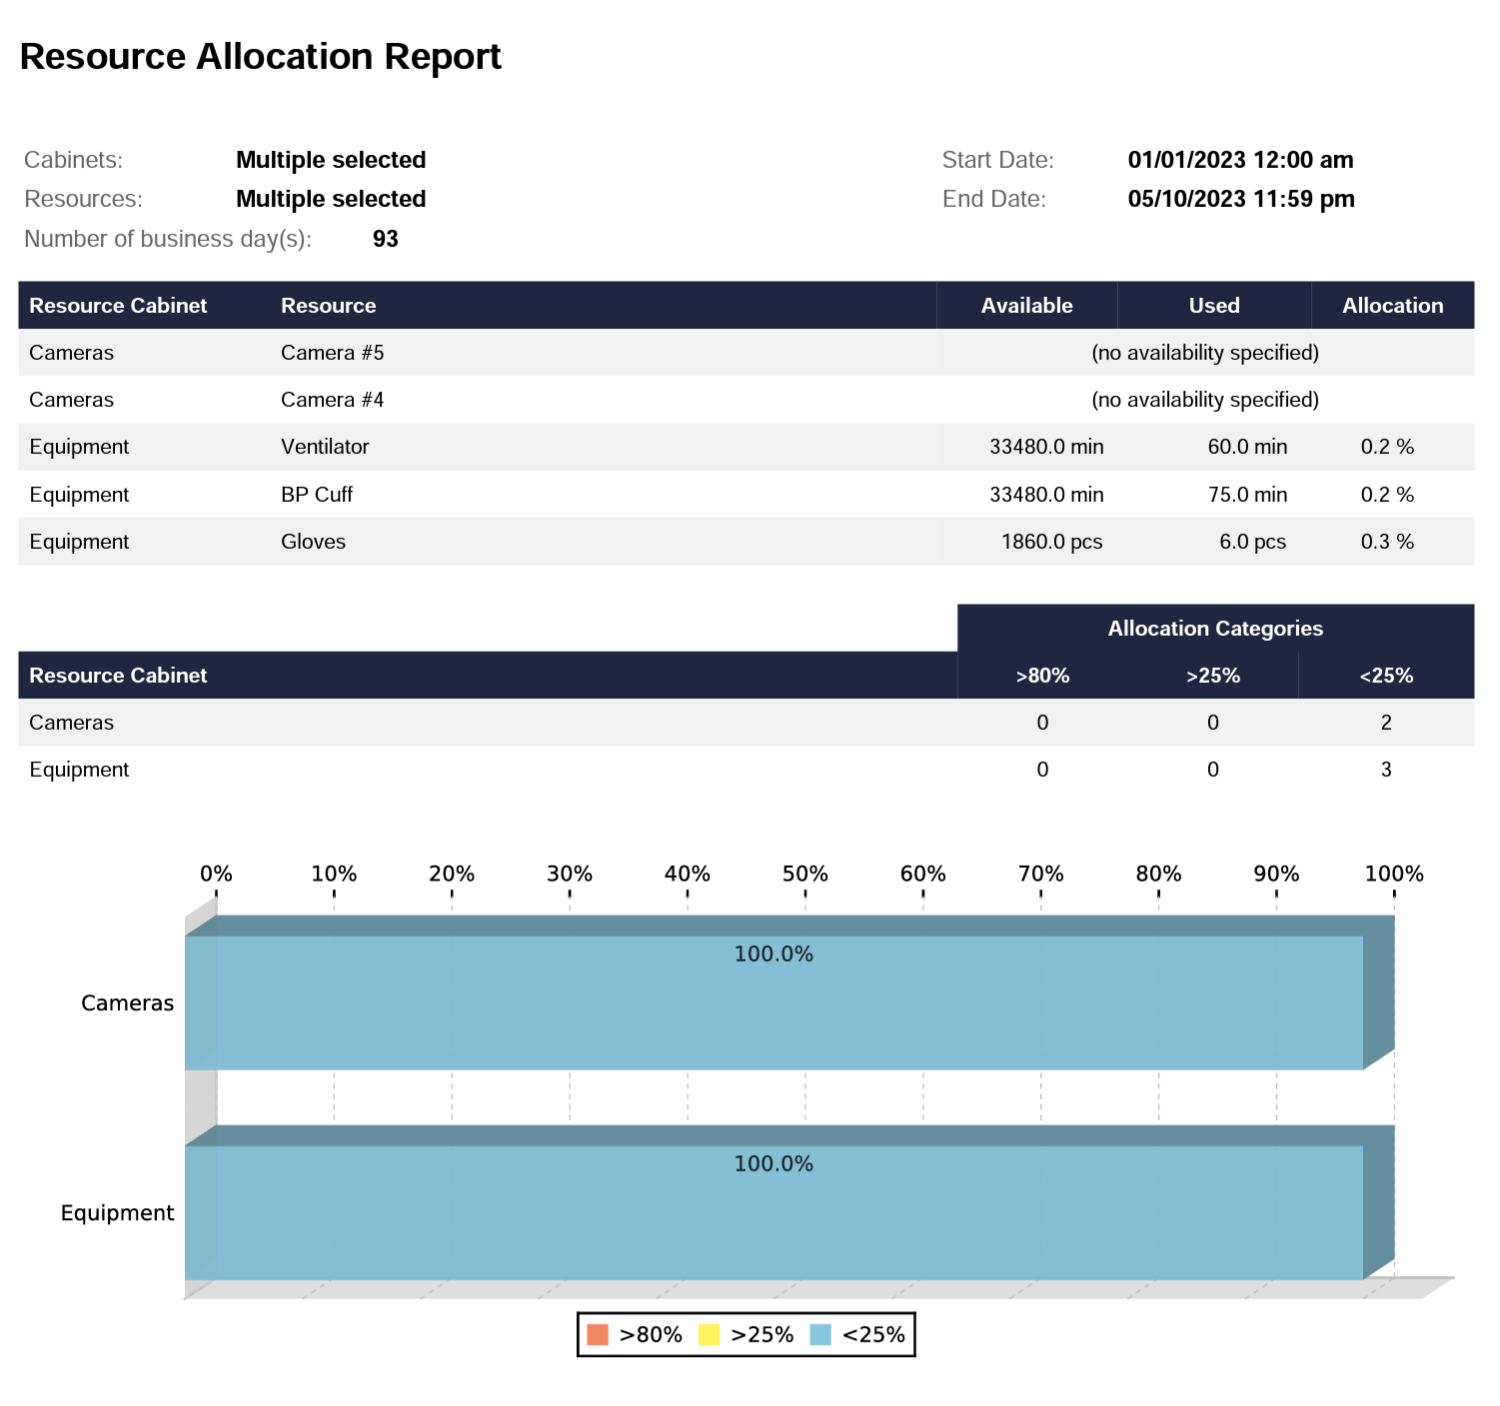
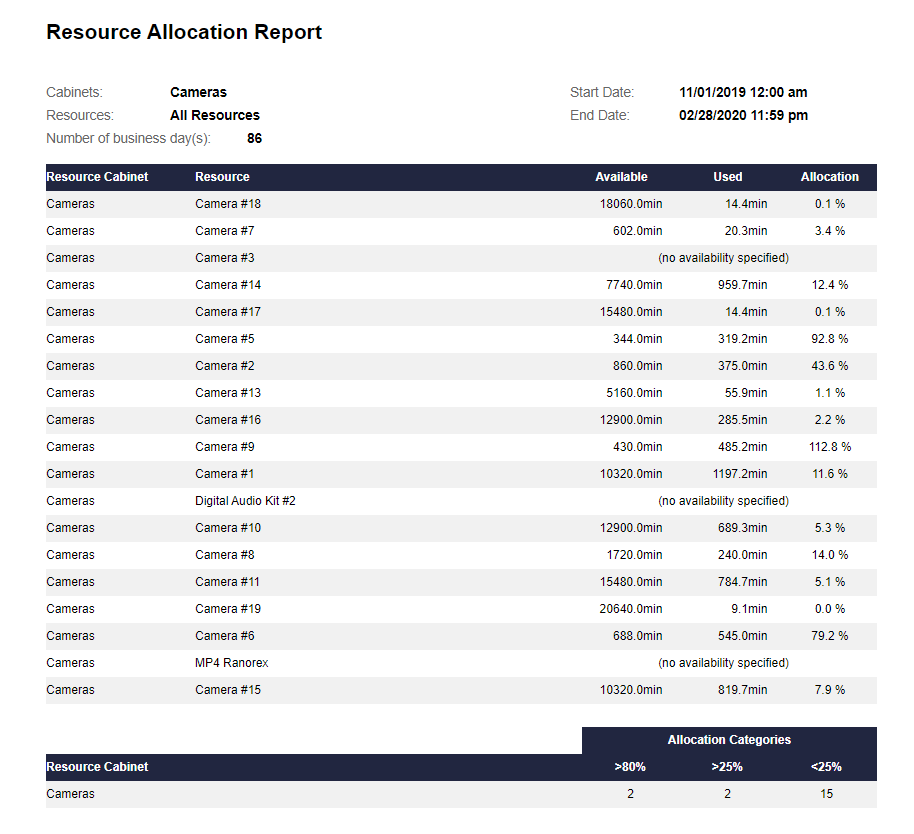
Resource Allocation
Check the utilization rate of each resource of one or more selected categories over a specified time range.
| Note | ||
|---|---|---|
| ||
The report calculates the total available capacity of each resource by multiplying the daily availability of a resource—which can be set up in Resources for each resource—by the number of weekdays of a given period (including holidays that occur on weekdays). |

| Info |
|---|
For more information visit our Reports Tab in Resources and Resources - How to pages. |
Overview
Content Tools