Page History
Chart view is available for the available preset/system-set reports on the Scores tab.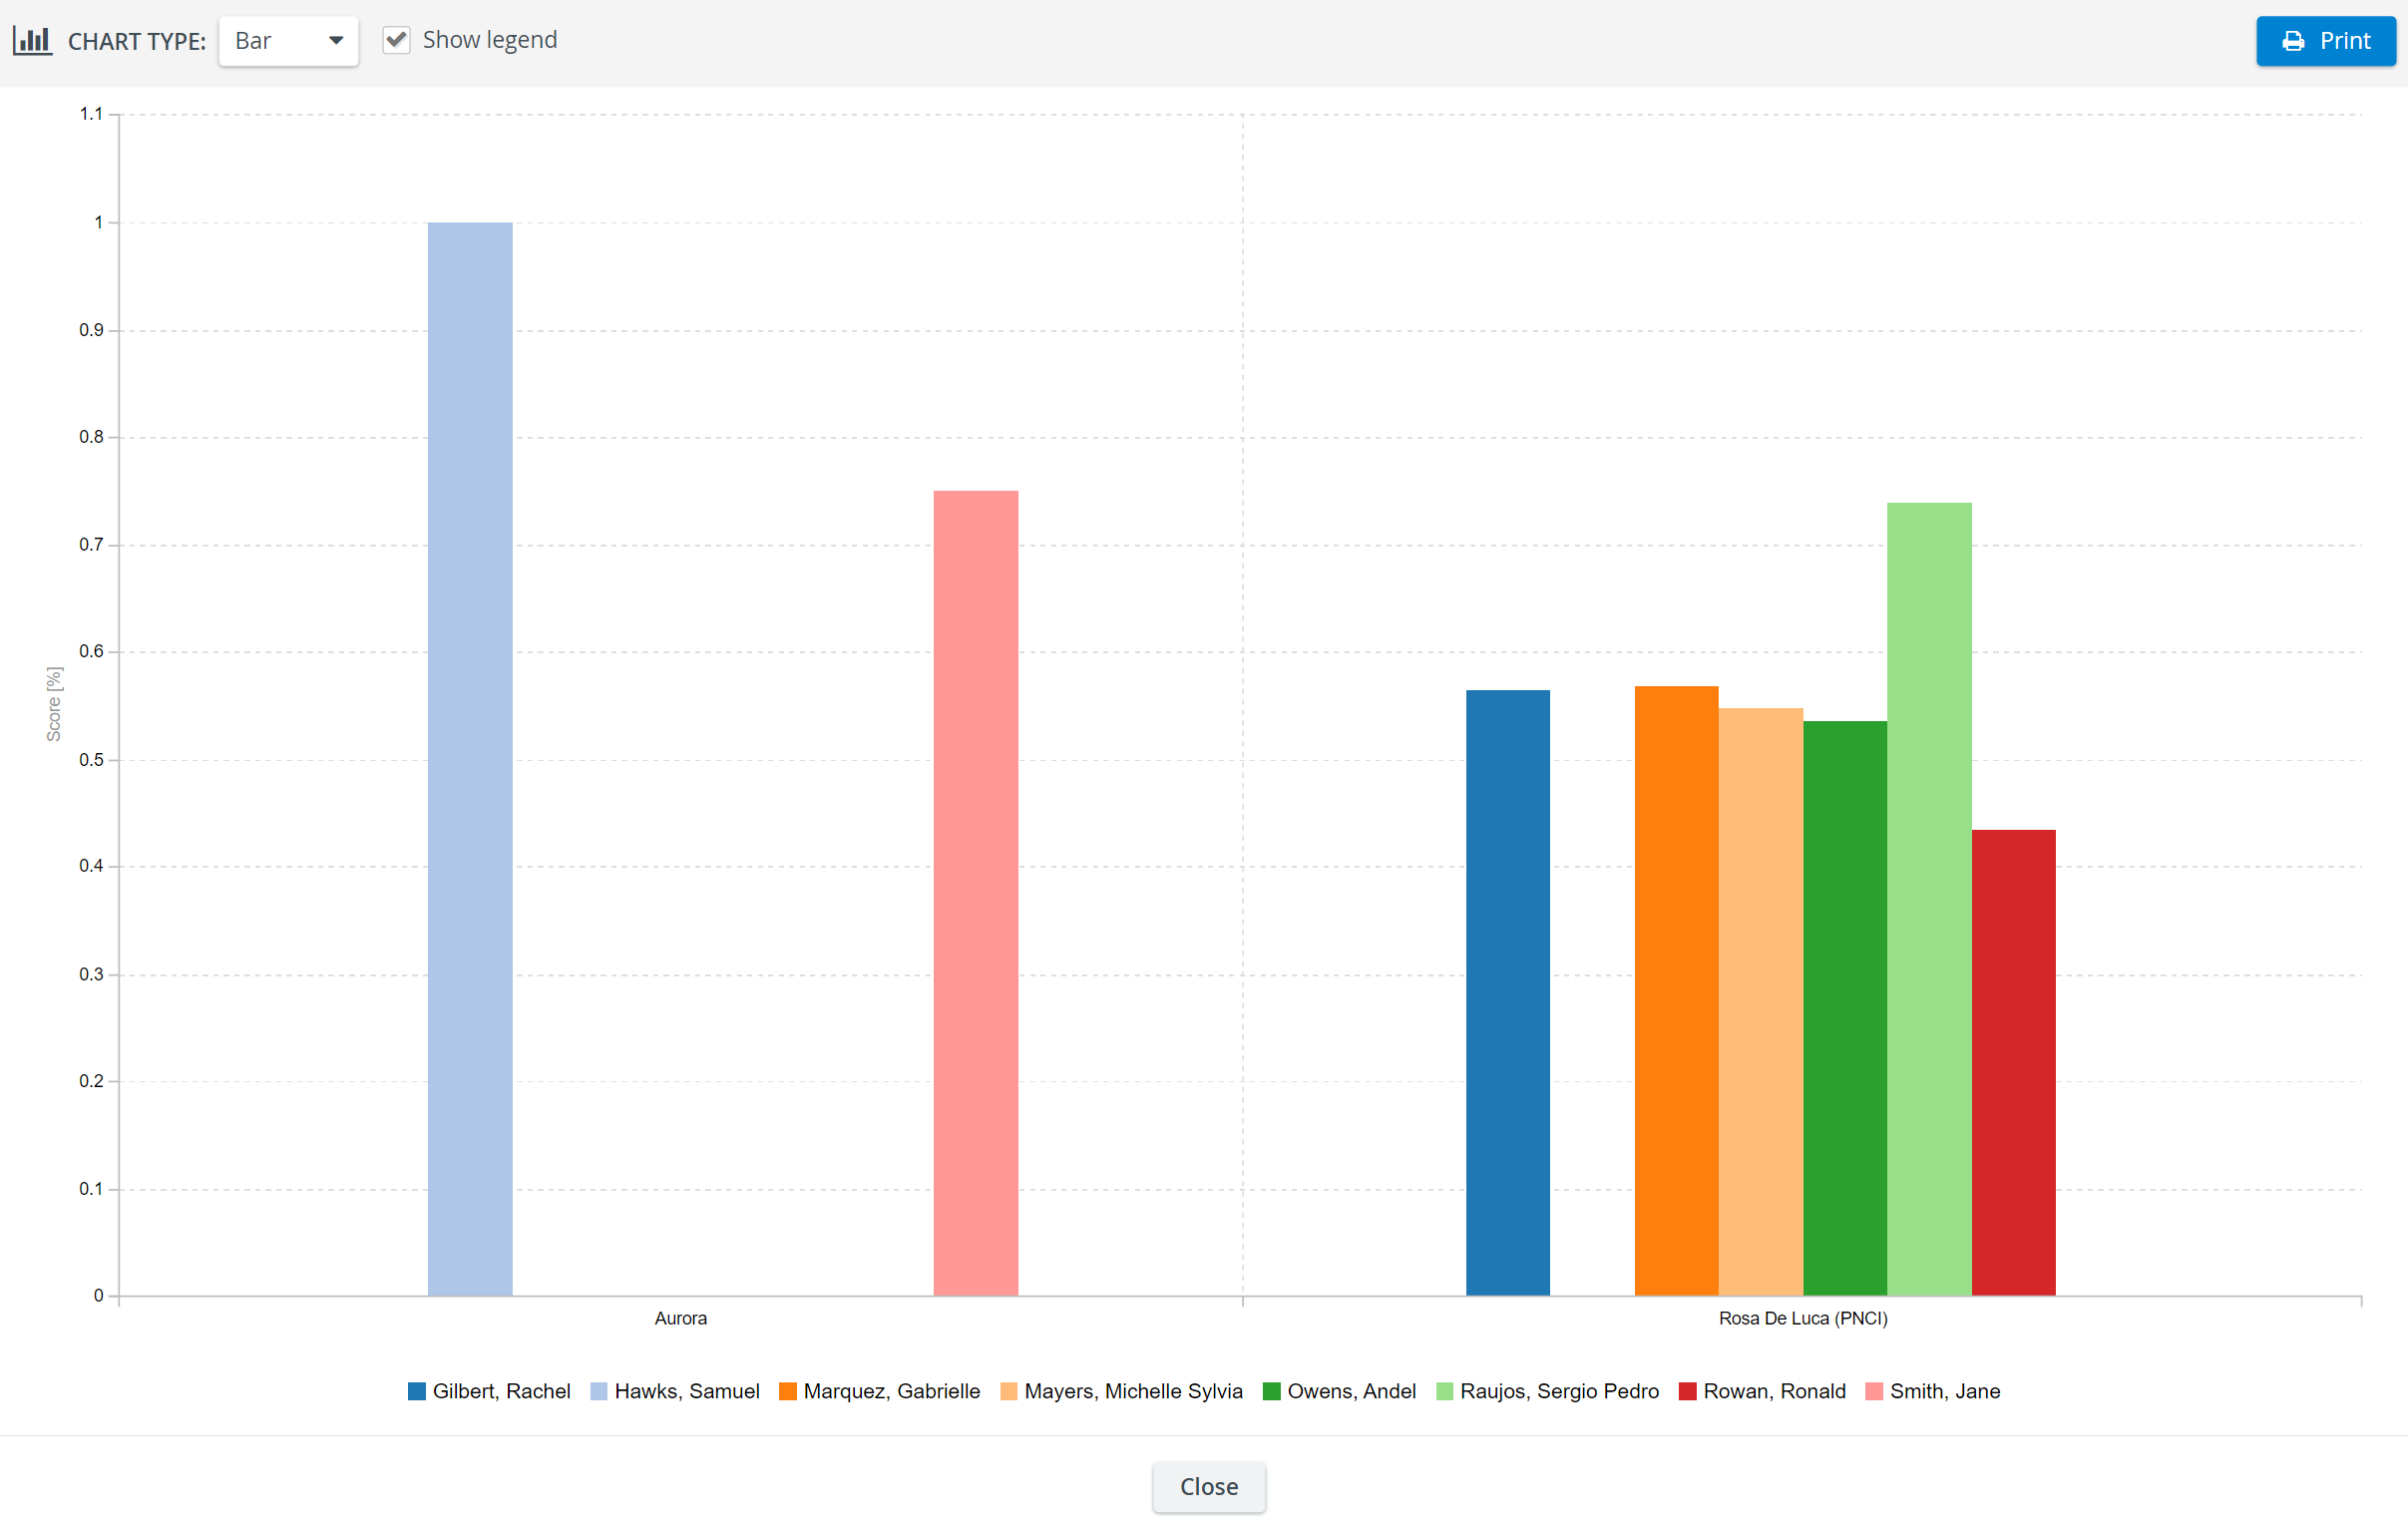
- Select the report intended to be displayed via the Reports drop-down in the top right corner of the tab.
- Once the report is displayed, click the chart icon
 next to the drop-down.
The chart of the formatted report appears in a pop-up.
| Tip |
|---|
When hovering over the chart, a tooltip appears with detailed data on the scores. |
3. Change the chart type using the drop-down menu in the top left corner.
4. Check the box next to Show legend to display data about the bars.
| Tip |
|---|
When the legend is displayed, hovering over a specific item of the legend prompts all the bars to be paled except that of the specific item. |
5. Print the chart if desired by clicking the Print button ![]() in the top right corner of the window.
in the top right corner of the window.
| Info |
|---|
See also: |
| Info |
|---|
For further information, visit our Reports Module pages. |
Overview
Content Tools