- Create a customized report on the Scores tab as described at How to Create a Custom-Designed Report.
- To add average value to either, both or all category(ies) selected as column or row categories, click the cogwheel icon in the top right corner of the screen.
The Score Settings pop-up window appears.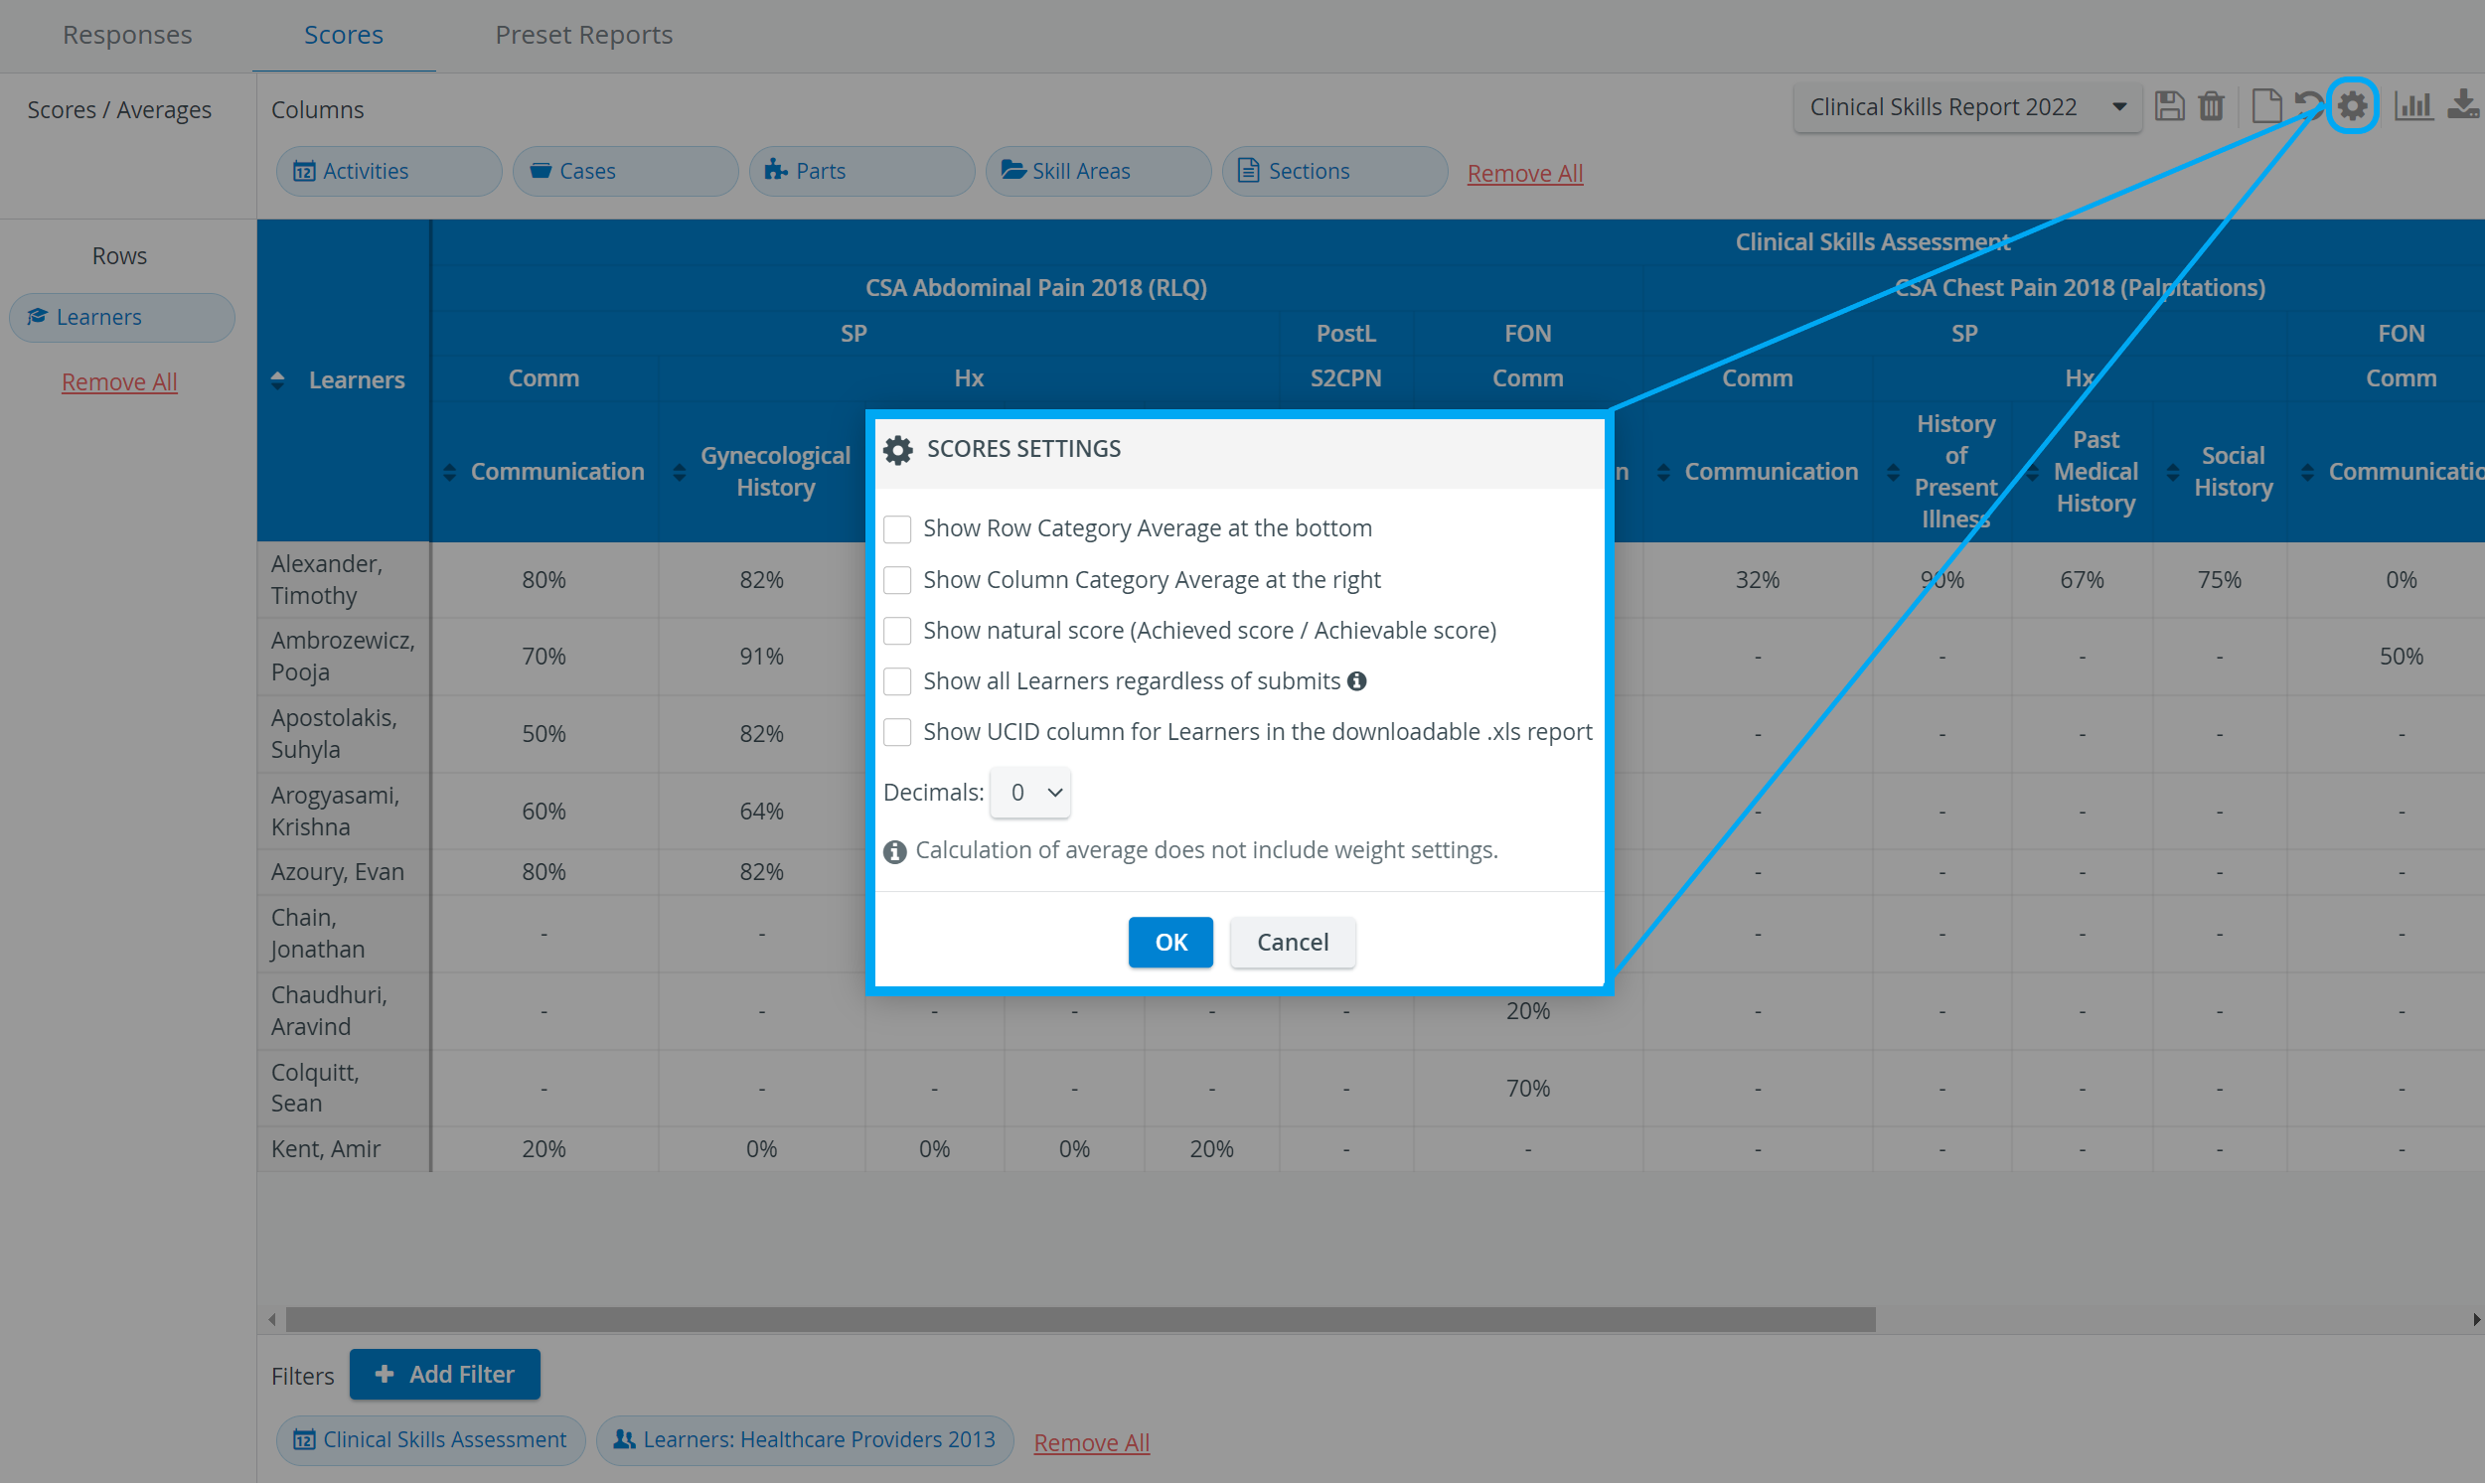
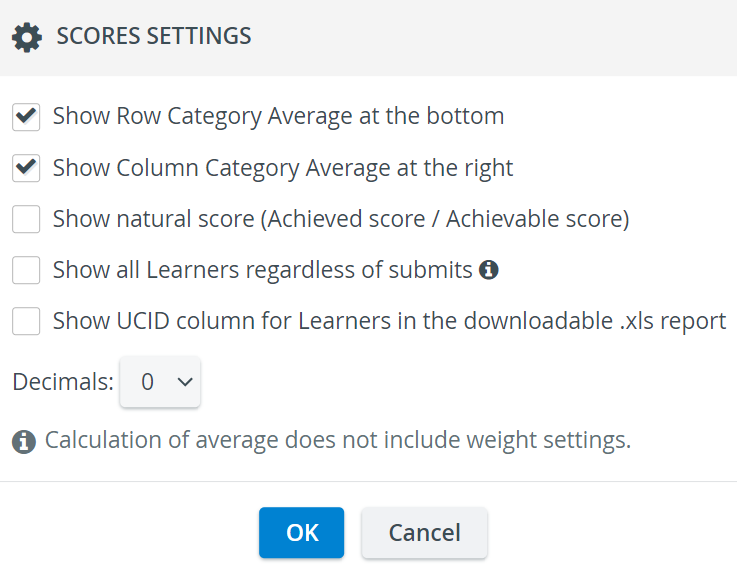
Check the box next to Show Row Category Average and/ or Show Column Category Average to have the average of the selected category(ies) displayed at the end of the row or the bottom of the column.
 TIP: Decimals can also be set for display by selecting the desired number from the respective drop-down.
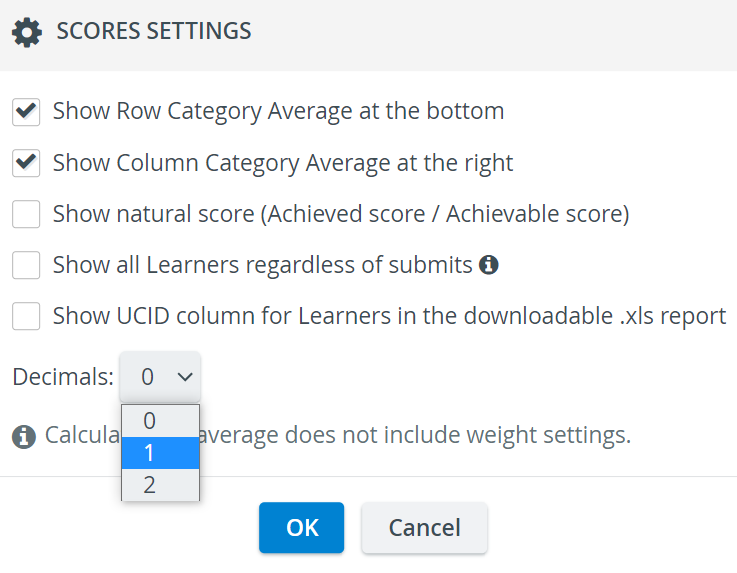
- Click OK to save the settings.
The average values would be displayed as set.
IMPORTANT: The average calculated does not include weight settings.
Learn more on the Reports Module pages and from our Reports Module Training Videos.
Overview
Content Tools