Users with Report Reviewer (full control), Report Reviewer, or Anonymous Report Reviewer privilege have access to the Scores tab.
Privileges
In the case of each privilege, users can only access the scores of the activities they are assigned to as faculty member. Basic Report Reviewers or Anonymous Report Reviewers may be limited access to activities via the Reports tab of the Edit Activity pop-up.
- Click the Reports module on the Dashboard. By default, the Responses tab opens.
- Switch to the Scores tab.
- The Scores tab is empty by default, click the +Add Column button to decide what category you want the columns to show.
Multiple categories can be added to the columns thereby providing a more detailed display of scores. - Click the +Add Row button to decide what category you want the rows to show.
The scores will be displayed in relation to the selected column and row categories.
While selecting column or row categories is interchangeable, the selected categories are mutually exclusive. That is, any category already added as column category will not be available as row category.
5. Click +Add Filter in the bottom panel to further specify scores intended to be displayed.
When a filter category is added, a drop-down menu appears where the actual filter can be selected.
Note
Multiple filters of multiple categories can be added.
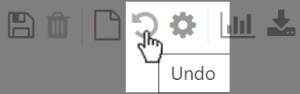
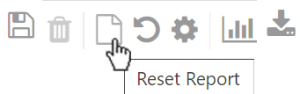
Click the Undo icon to reverse the last change, or click the Reset icon to start over the formatting.
The Groups filter lists only the participant group assigned to the Activity (Learner group), it does not include Learner or Evaluee subgroups.
6. Use the icons in the top right corner of the tab to apply further options.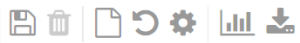
![]() Save Setup - a custom-designed report can be saved by clicking the Save Setup icon;
Save Setup - a custom-designed report can be saved by clicking the Save Setup icon;
![]() Delete report - delete a custom-designed report;
Delete report - delete a custom-designed report;
![]() Reset Report - start over the formatting;
Reset Report - start over the formatting;
![]() Undo - reverse the last change;
Undo - reverse the last change;
![]() Settings - the Scores Settings pop-up provides further options to specify the report;
Settings - the Scores Settings pop-up provides further options to specify the report;
![]() Display chart - reports created can be displayed in chart format via the icon (See How to View and Print Chart for a Report)
Display chart - reports created can be displayed in chart format via the icon (See How to View and Print Chart for a Report)
![]() Download reports - customized reports can be downloaded in Excel format. (See How to Download a Report in Excel)
Download reports - customized reports can be downloaded in Excel format. (See How to Download a Report in Excel)
Drag and drop selected categories to switch between column and row parameters.
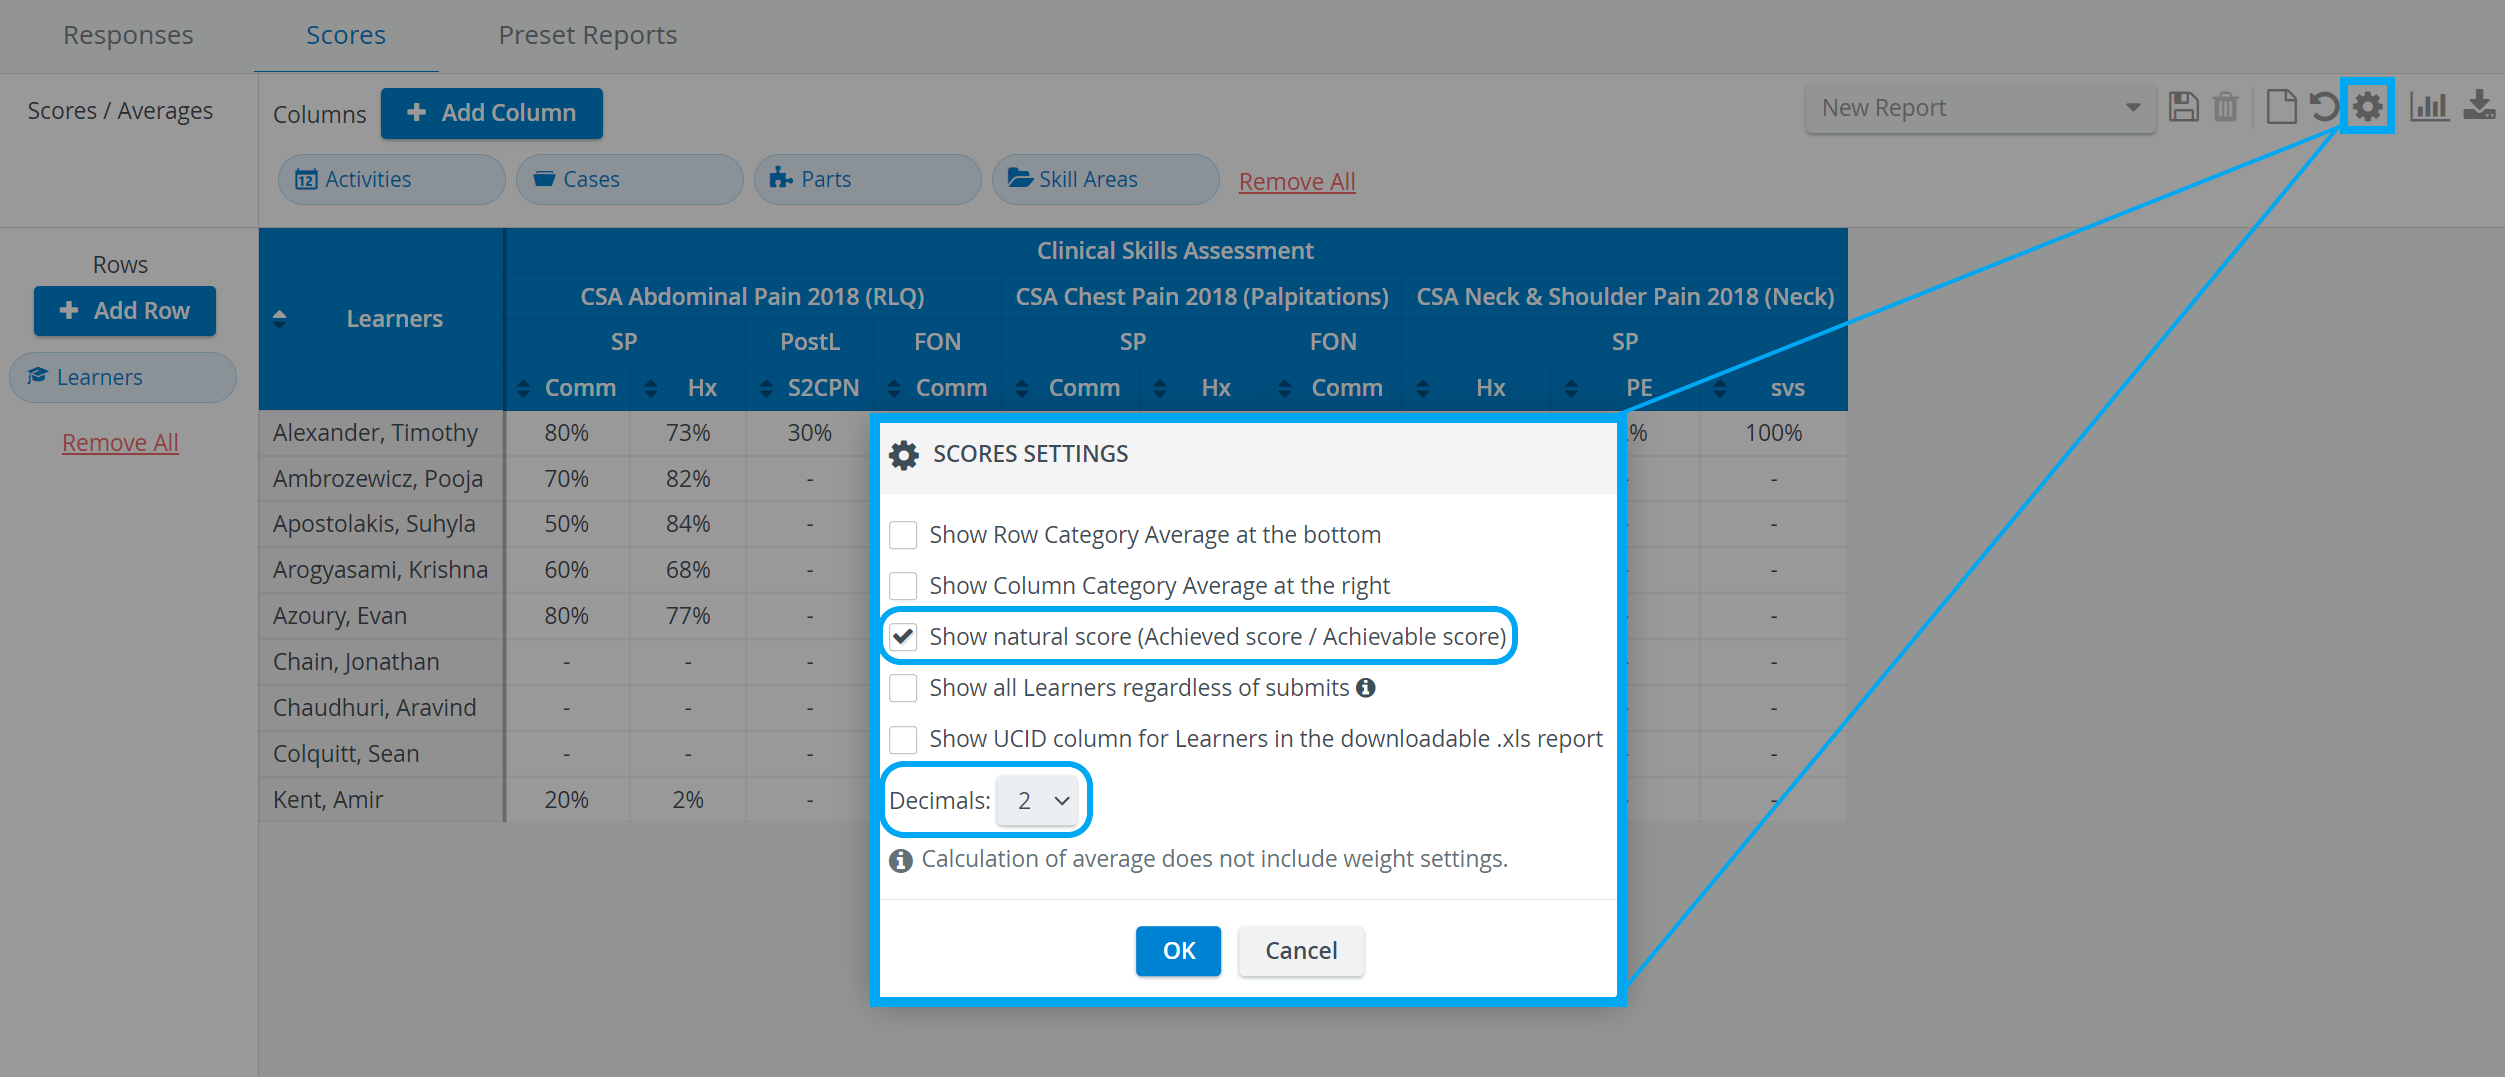
Decimals and Natural Score Display
As the decimals refer to the scores in percentage, they are not displayed if the natural score option is selected.
Once a customized report has been created, click the cogwheel icon in the top right corner of the tab. In the Scores Settings pop-up, the two options can be activated as follows:
- Decimal place: click the drop-down at Decimals and select the required value
- Natural scores: tick the checkbox next to Show natural score (Achieved score / Achievable score)
To confirm, click OK at the bottom of the pop-up.
See details on the further options available in the Scores Settings pop-up here.
Overview
Content Tools