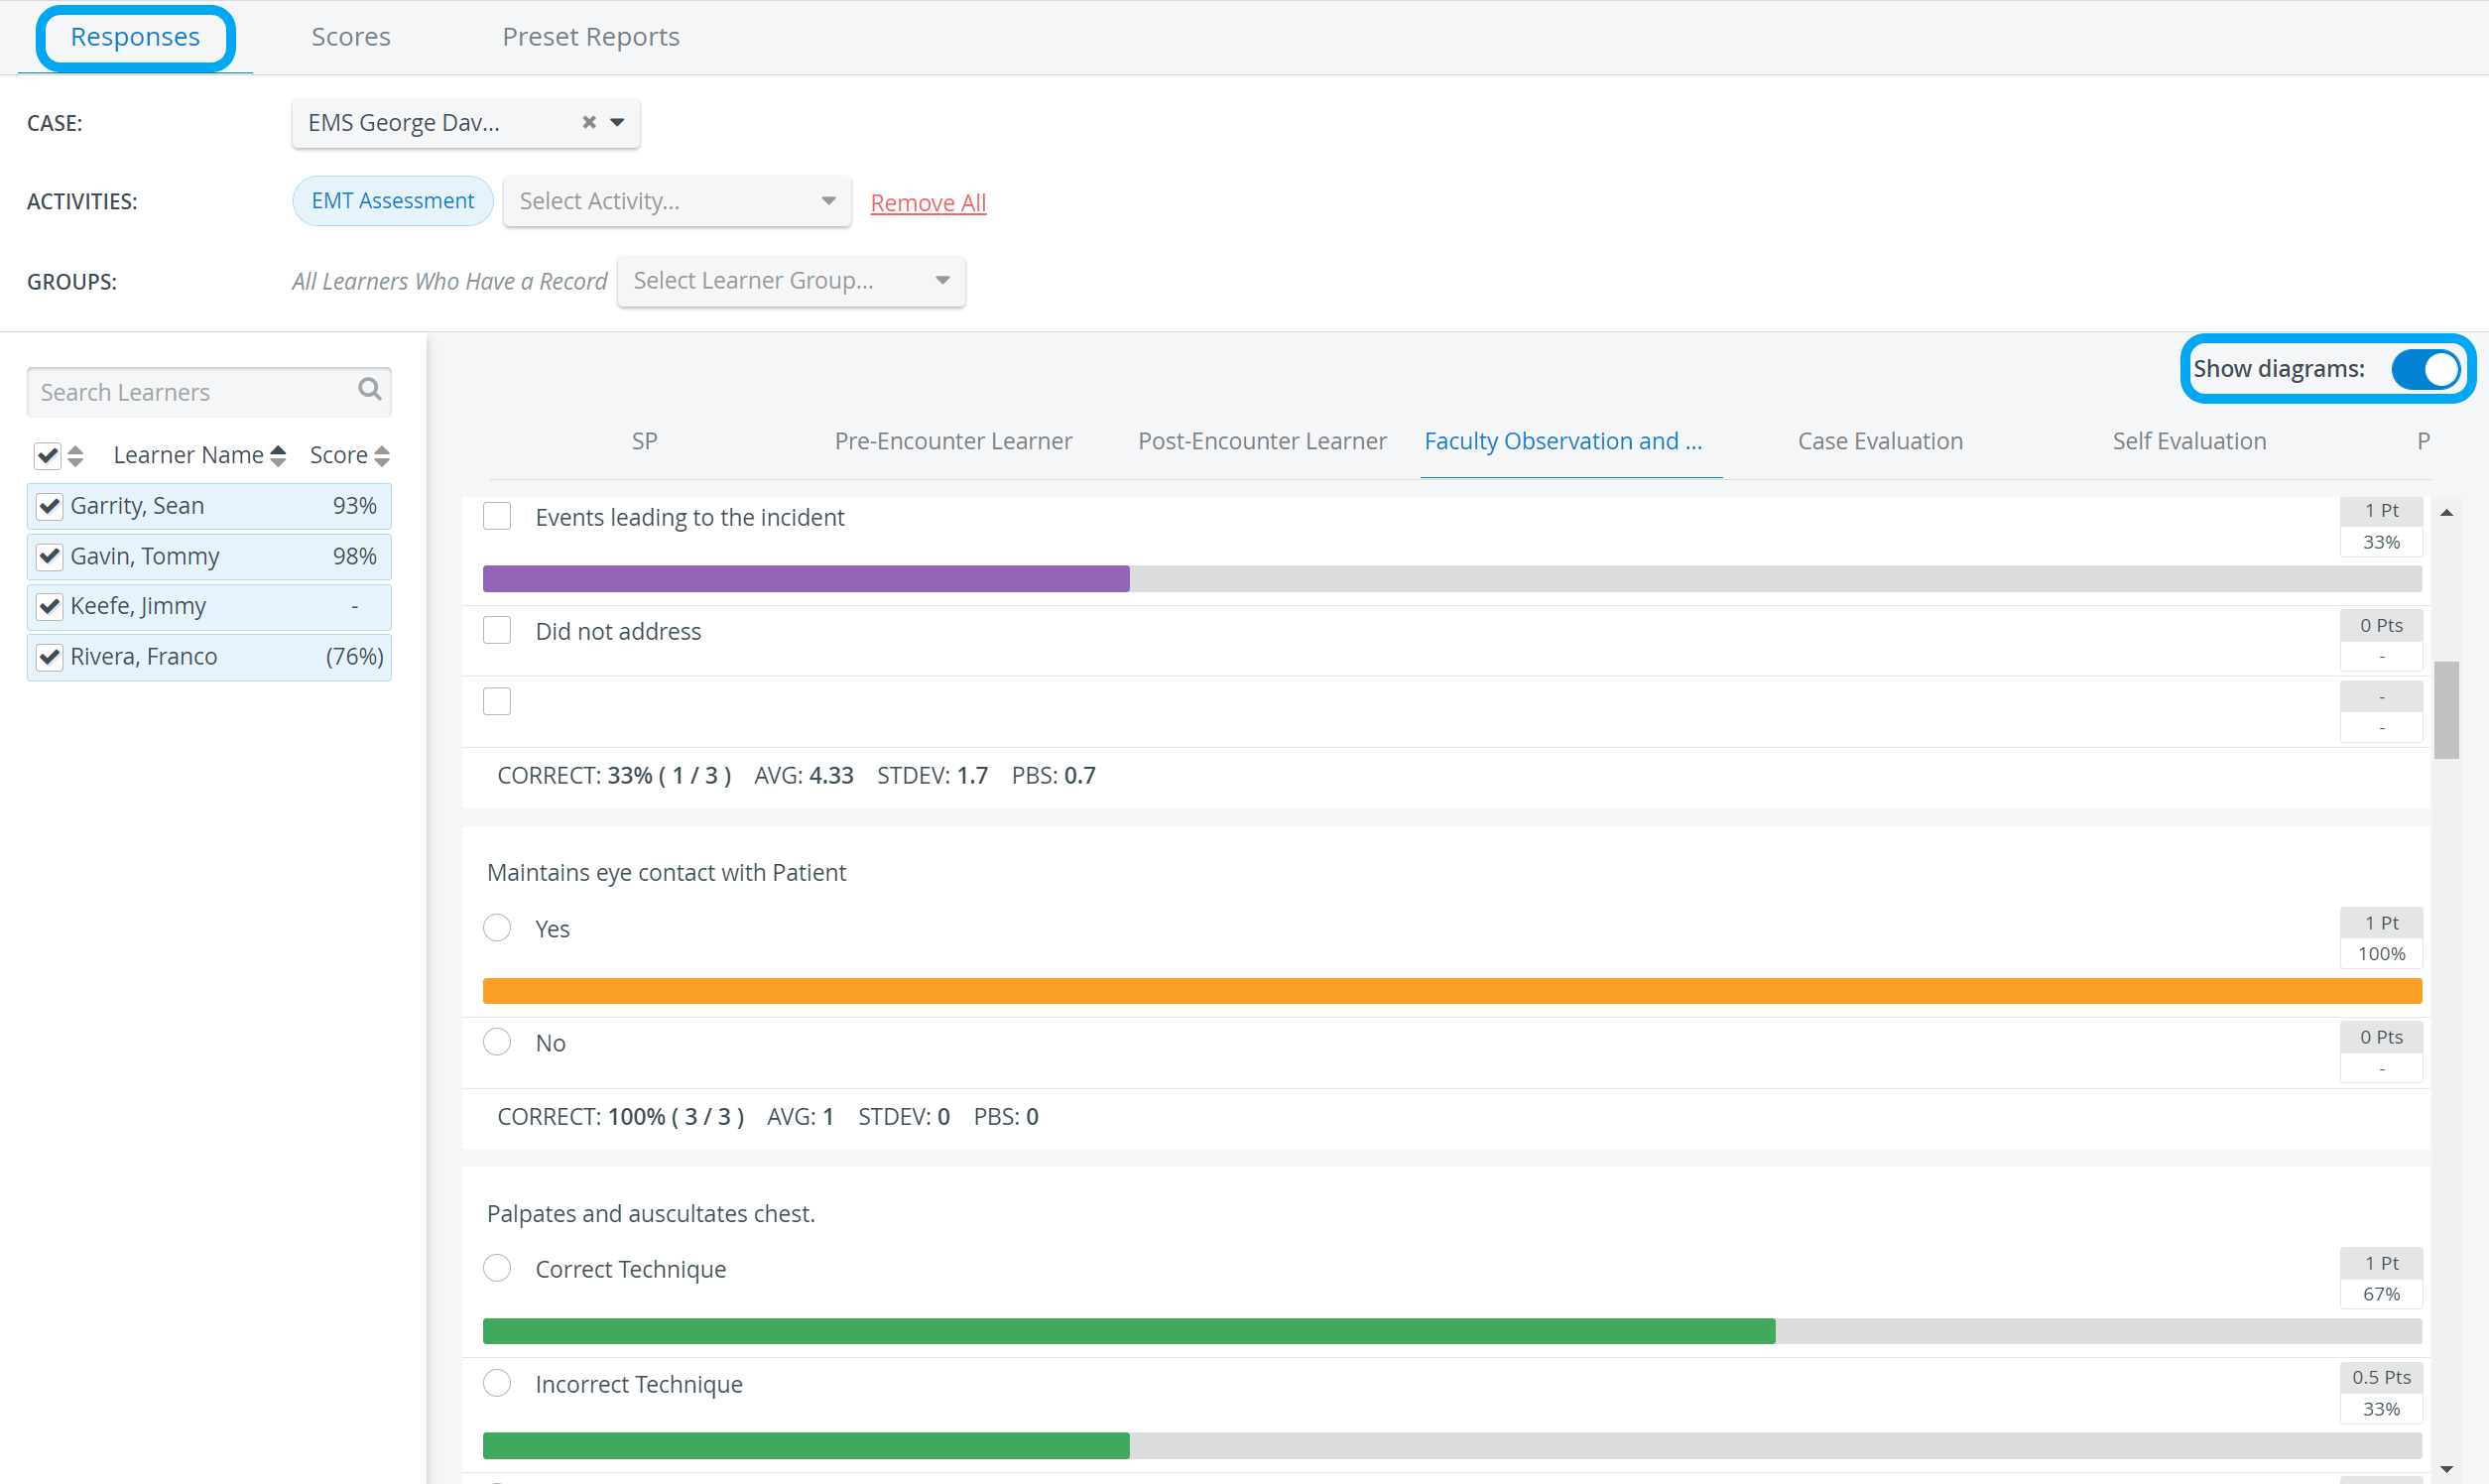
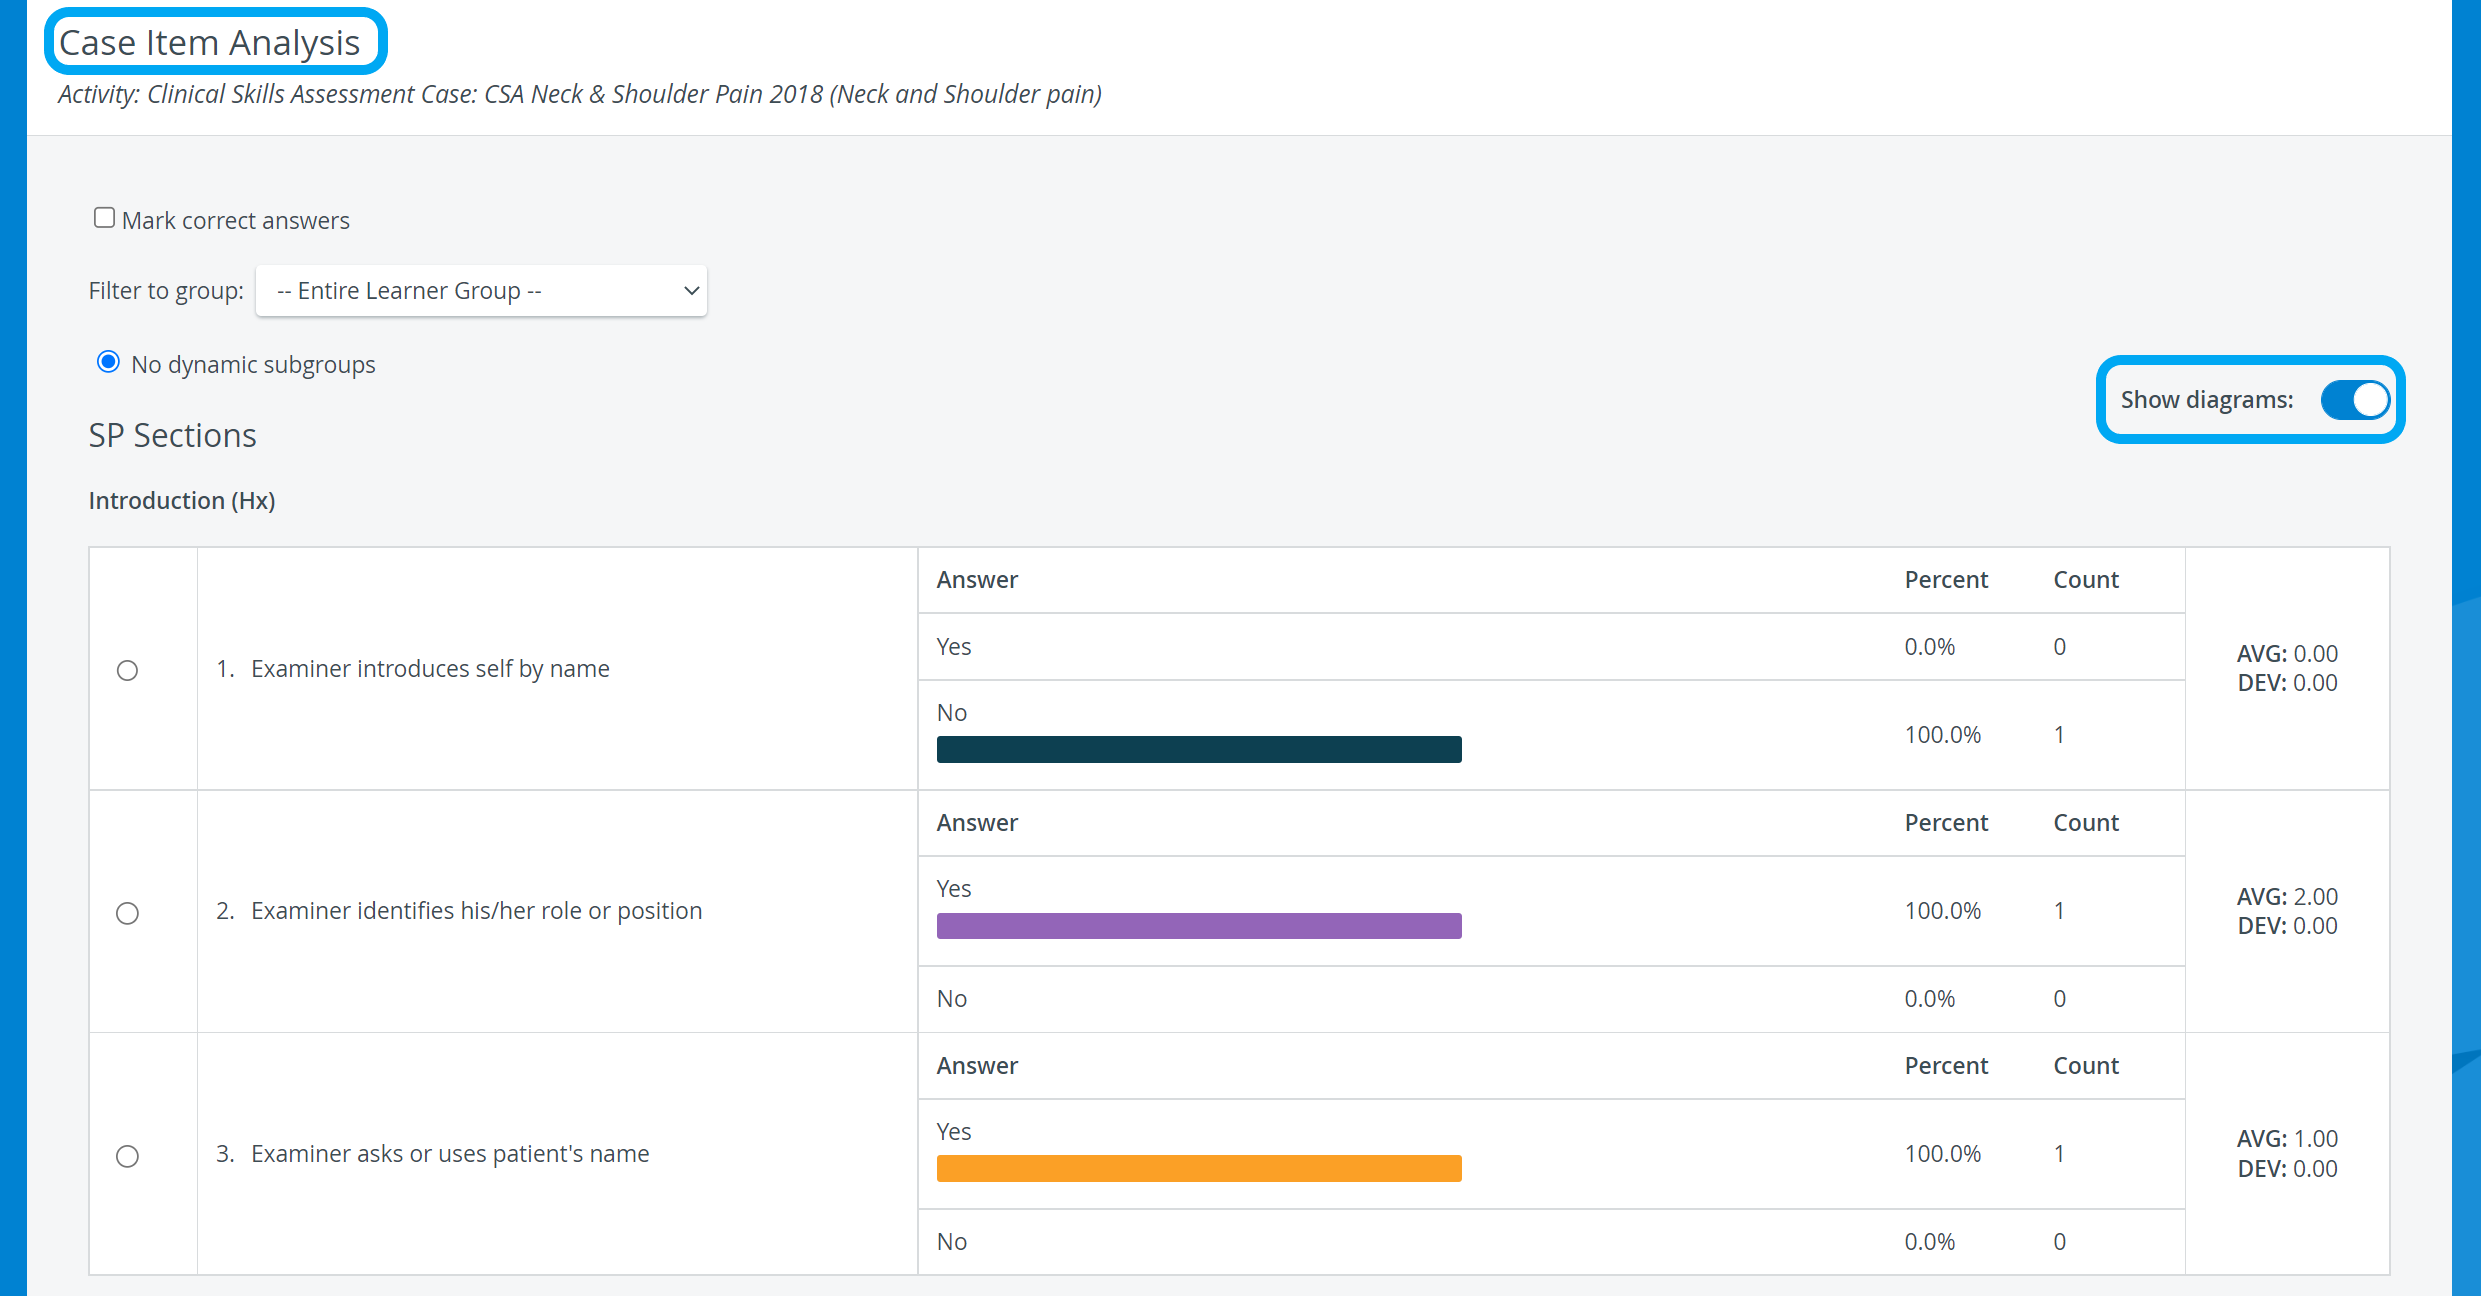
Histogram is a visual aid within the Reports module: it offers a comparative graph about the responses given to the items of a checklist.
It provides information on the percentage distribution of answers and can be filtered for by item.
IMPORTANT: As the histogram is for comparative purpose, it is only displayed when more than one learners are selected.
The histogram is available on the following pages of the module:
- Responses tab
- Case Item Analysis page of the Preset Reports tab
Display can be enabled by the Show diagrams switch in the top right corner of either page. By default, the Show diagrams switch is disabled, but the setting determined by the user will saved for the individual account.
NOTE: If an answer has not been selected by anyone, no bar is displayed (as opposed to displaying anything grayed).
For printing reports containing Histograms (diagrams), the Background graphics option has to be enabled in the Print preview window (More settings > Options).
![]() For more information go to How to Print a Report.
For more information go to How to Print a Report.
For further information, see the Reports - How to pages and the Reports Module Training Videos.
Overview
Content Tools