In the Scores tab, data tables can be set up with customized rows and columns. You can add score categories inside the Scores tab once you have collected data about simulated patient encounters from learners and faculty.
The custom-designed report can then be further filtered to show a specific range of data.

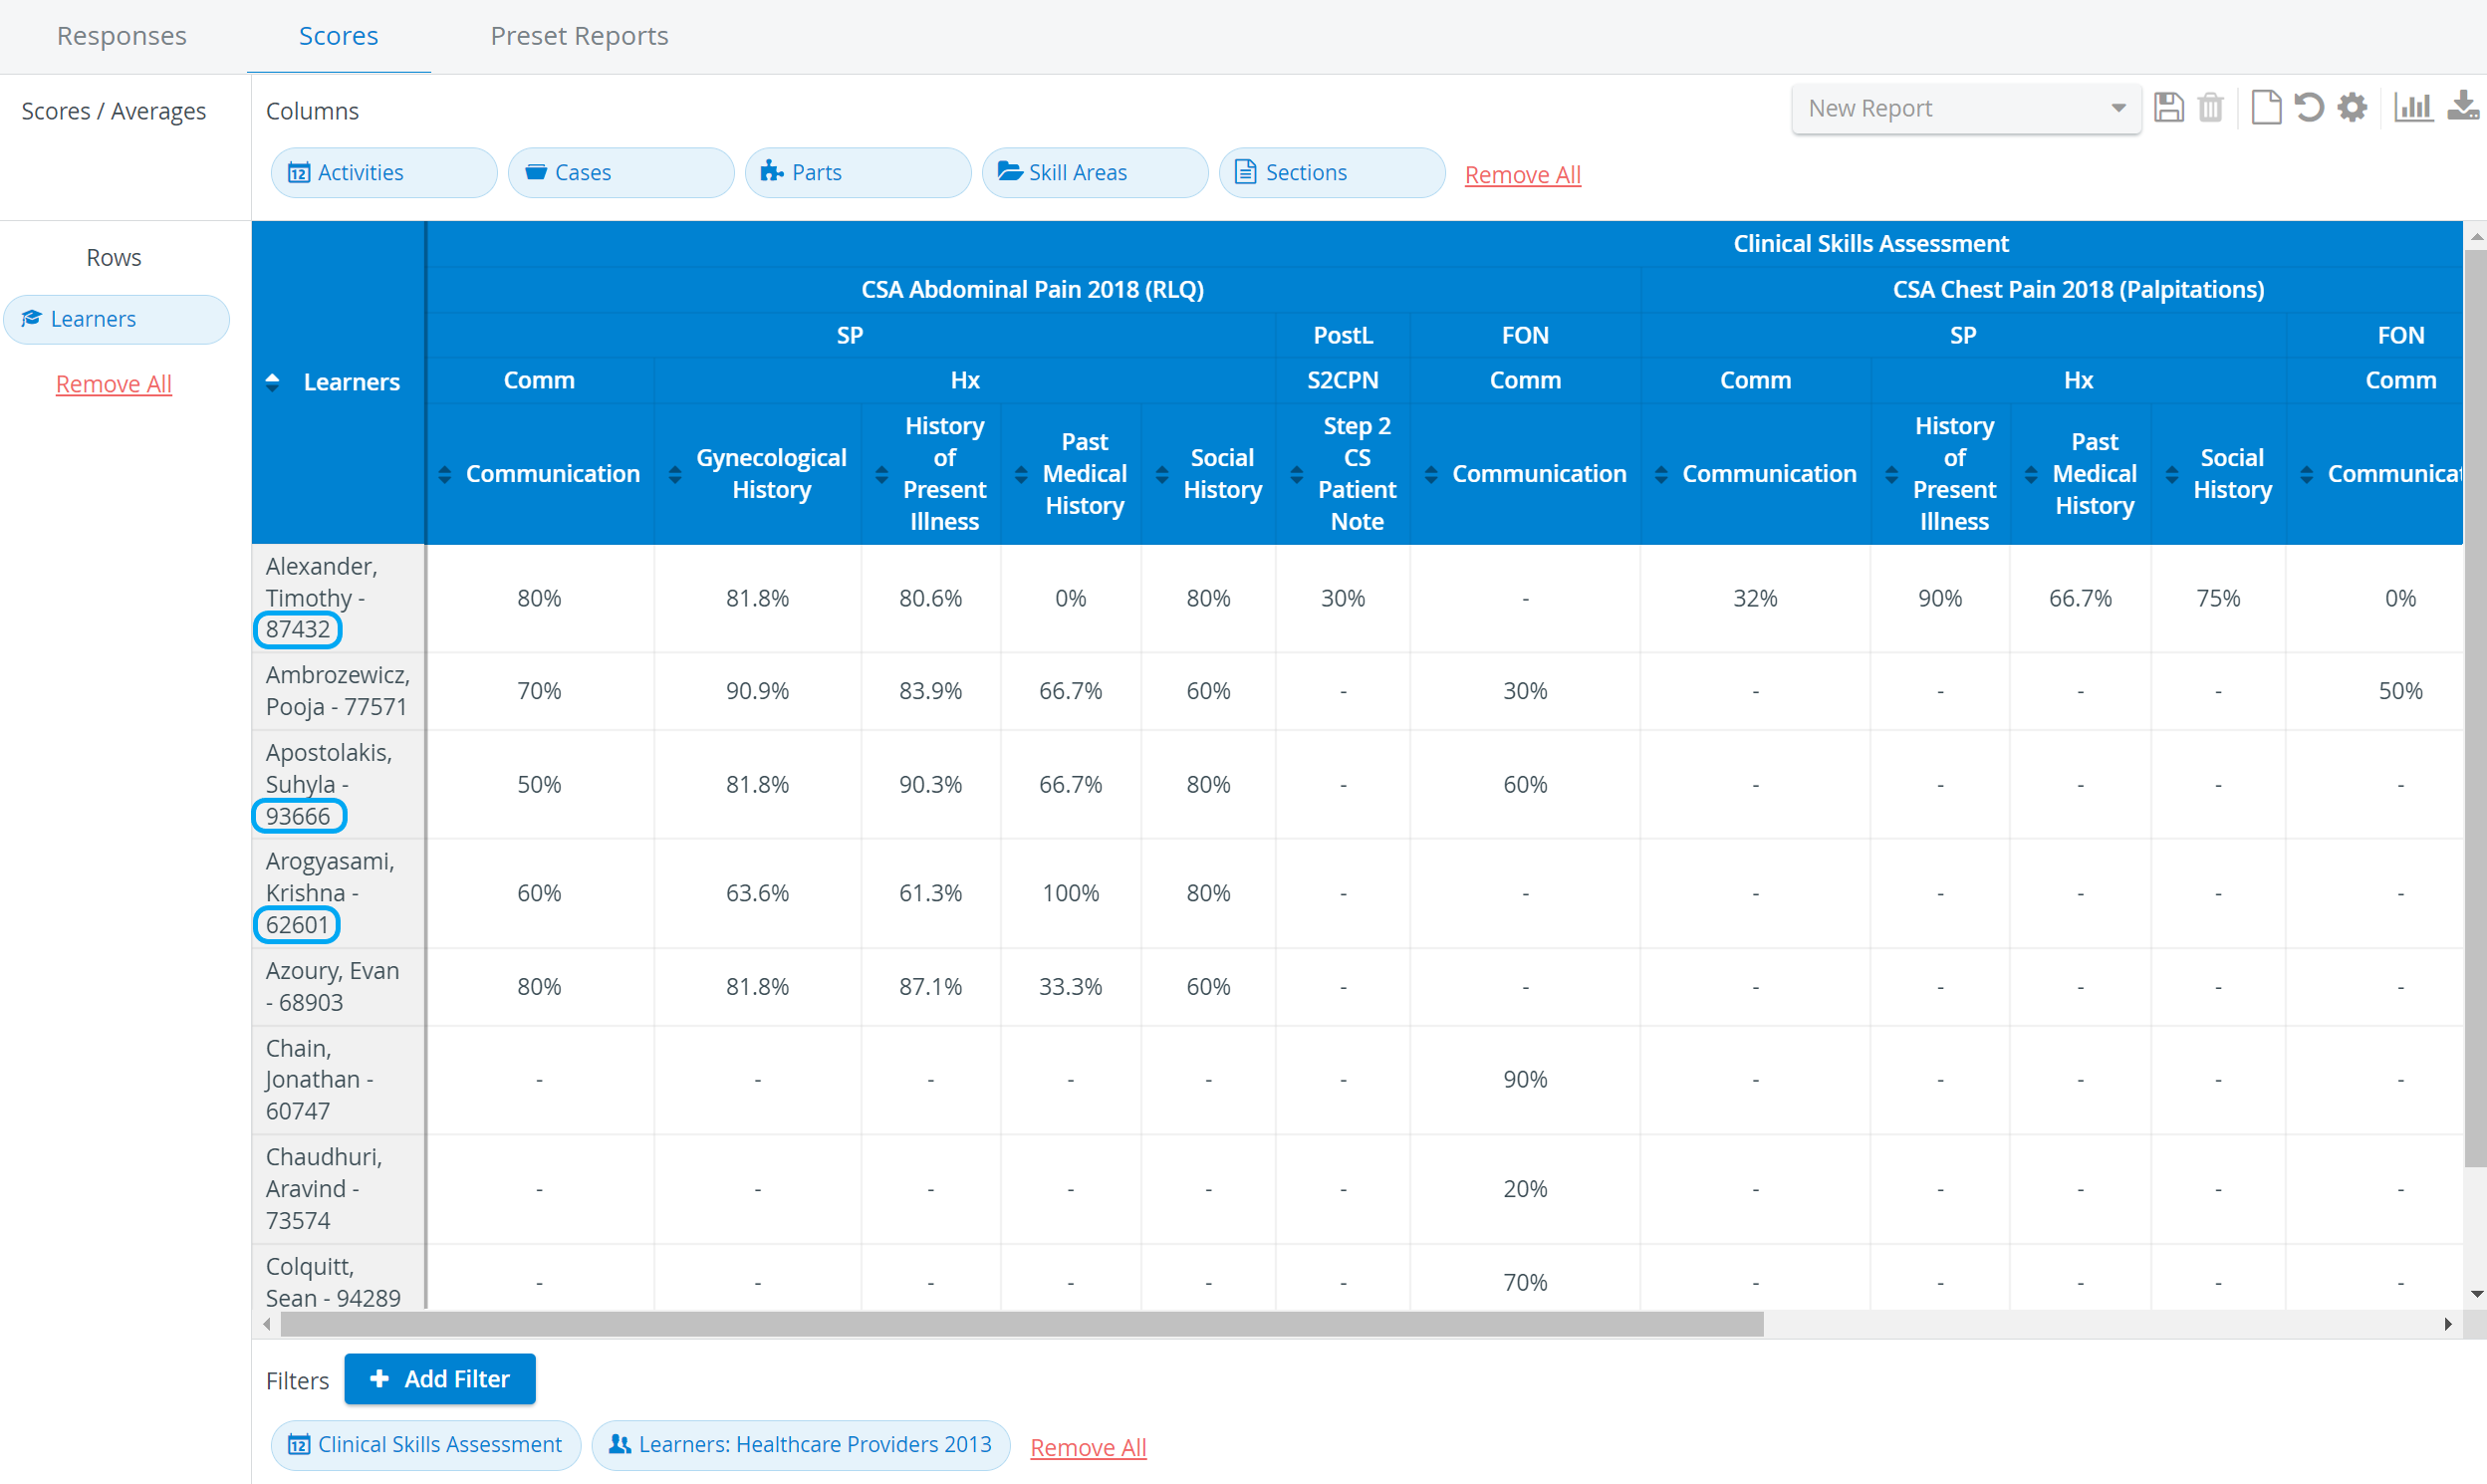
The Scores tab calculates the percentage or the natural score of specific data fields. You can check:
- the activity average of a Learner
- the average score of a Case
- the average of a Section
- Learner scores by Skill areas, etc.
See details at How to Create a Custom-Designed Report.

The Groups filter lists only the participant group (Learner group) assigned to the Activity, it does not include Learner or Evaluee subgroups.
Scores Settings Pop-up
While customizing the report, steps can be undone or the process can be started over with the Undo button![]() .
.
In the Score Settings pop-up - opened by clicking the cogwheel ![]() - the following options can be selected:
- the following options can be selected:
| Row and column average | How to Add Average Values to a Report |
| Show natural score (Achieved/Achievable scores) | Natural score display |
| Show all Learners regardless of submits | Include Every Learner at Score Review |
| Show UCID column for Learners in the downloadable .xls report | UCID Column display in Excel |
| Decimals | Decimals display |

Natural Score and Decimals Display
To use either of the features, create your customized report, then click the cogwheel icon in the top right corner of the tab. In the Scores Settings pop-up, the two options can be activated as follows:
- Decimal place: click the drop-down at Decimals and select the required value
- Natural scores: tick the checkbox next to Show natural score (Achieved score / Achievable score)
To confirm, click OK at the bottom of the pop-up.
As the decimals refer to the scores in percentage, they are not displayed if the natural score option is selected.
UCID column Display in Excel
By activating the ”Show UCID column for Learners in the downloadable .xls report” checkbox, the UCID column is displayed next to the Learners column in the downloaded .xls.

The UCIDs are also displayed in the downloadable report, next to the Learners' names.
The UCID column is displayed if this setting is turned on and there is a Learners column present in the Scores table. Also, it is only visible when Learners are displayed as “columns”, not rows.
Save in Excel
Once finished, the customized reports can be saved and downloaded ![]() in Excel format. Any report setup can be saved and thus made readily available for other user(s) with the required privilege(s).
in Excel format. Any report setup can be saved and thus made readily available for other user(s) with the required privilege(s).


See more details at How to Save a Custom-Designed Report Format and How to Download a Report in Excel.
Display Chart
The reports created can be displayed in chart format via the Display chart icon.


See details at How to View and Print Chart for a Report.
For further information, see the Reports - How to pages and the Reports Module Training Videos.
Overview
Content Tools