The Grade Report is a detailed evaluation of a learner's performance for an Activity, including scores for every section of each Case, comparing it to class performance in various figures and diagrams.

The report displays
- a table for each Case of an Activity,
- listing all the sections of the assigned Case(s),
- it compares learners' performance with the class average, and evaluates this comparison in the light of class standard deviations. The data are also integrated in the figure of Z-score, which reflects how much a learner's performance differs from the average.

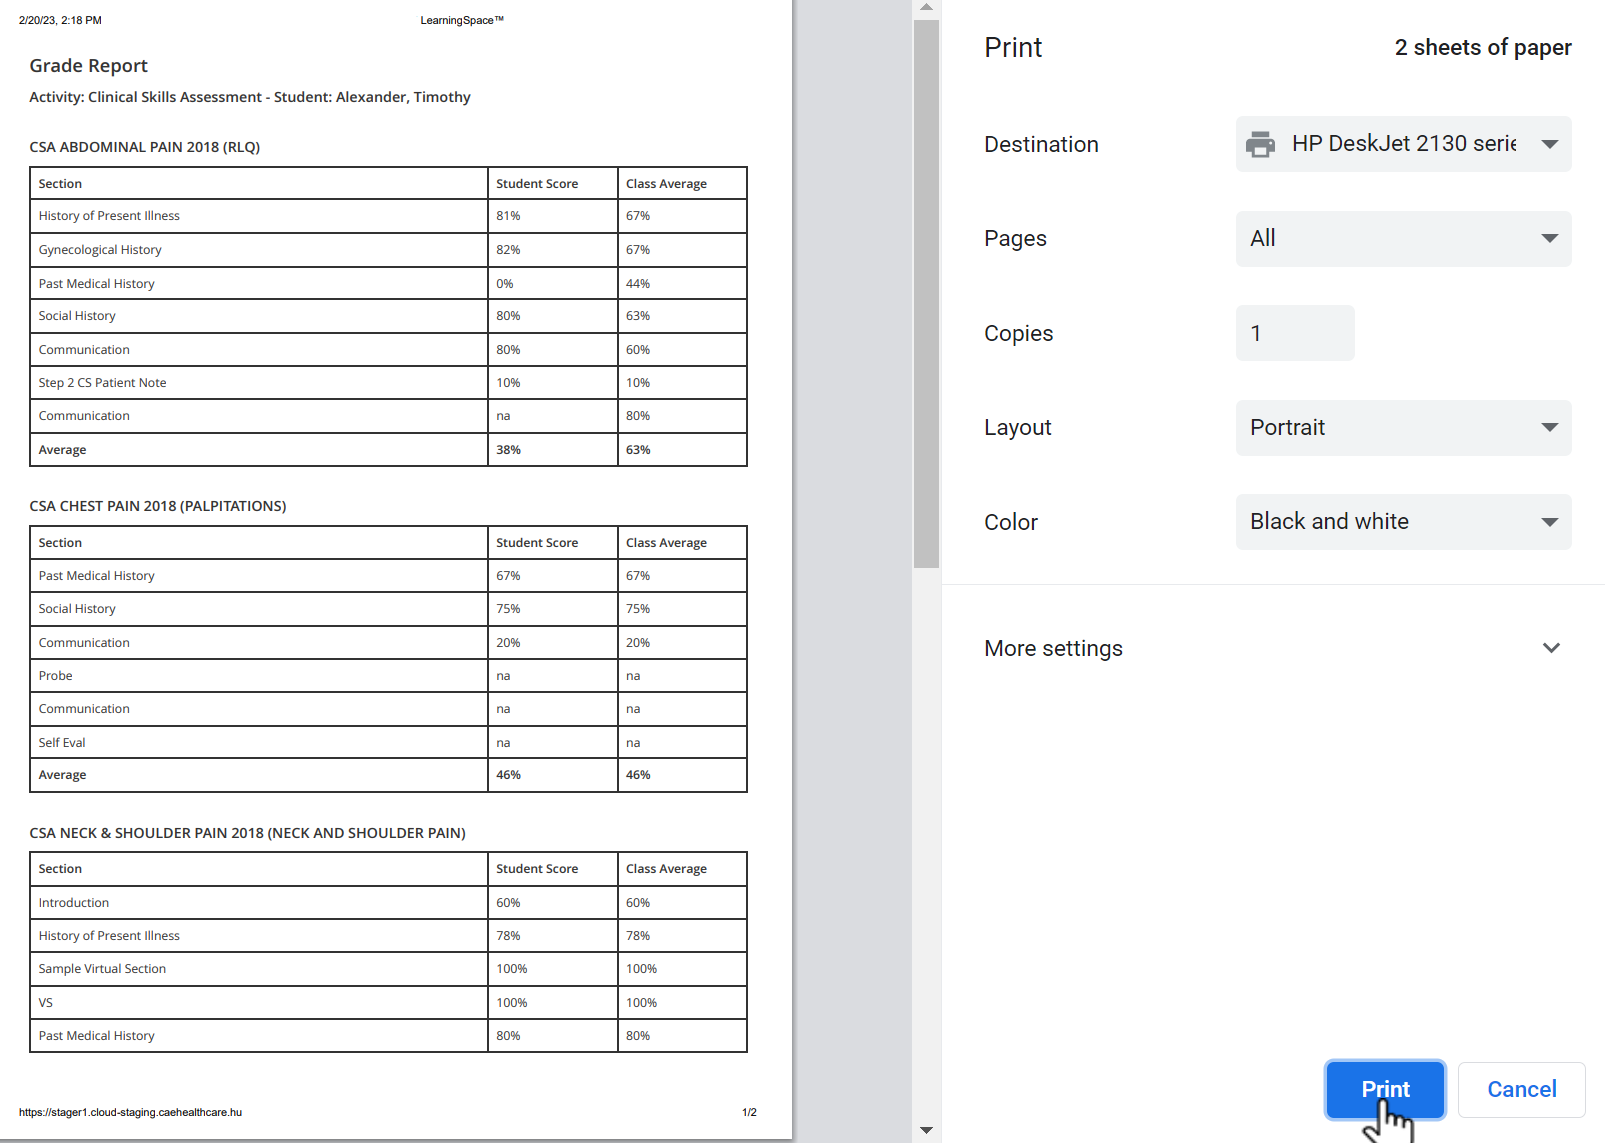
Grade reports also display Virtual sections (items with specific tags, creating a unit) used within a specific Case/Activity:

Display of comments, class standard deviation and Z-score depends on the settings activated in the Report Formatting panel of the Activity Reporting Setup page.

Changes of settings come into effect only after clicking on the Save button at the bottom of the page.

Printing a Report
To print a Grade Report (either to paper or to PDF), use the Print button in the top right corner of the screen.
Export to Excel
In the latest versions of LearningSpace, reports can also be exported into an Excel (xls) ![]() file for more convenient management and an essentially easier utilization of the exported data in applications like Microsoft Excel or Google Sheets.
file for more convenient management and an essentially easier utilization of the exported data in applications like Microsoft Excel or Google Sheets.

For more information go to How to Print a Report.
For further information, see the Reports - How to pages and the Reports Module Training Videos.
Overview
Content Tools