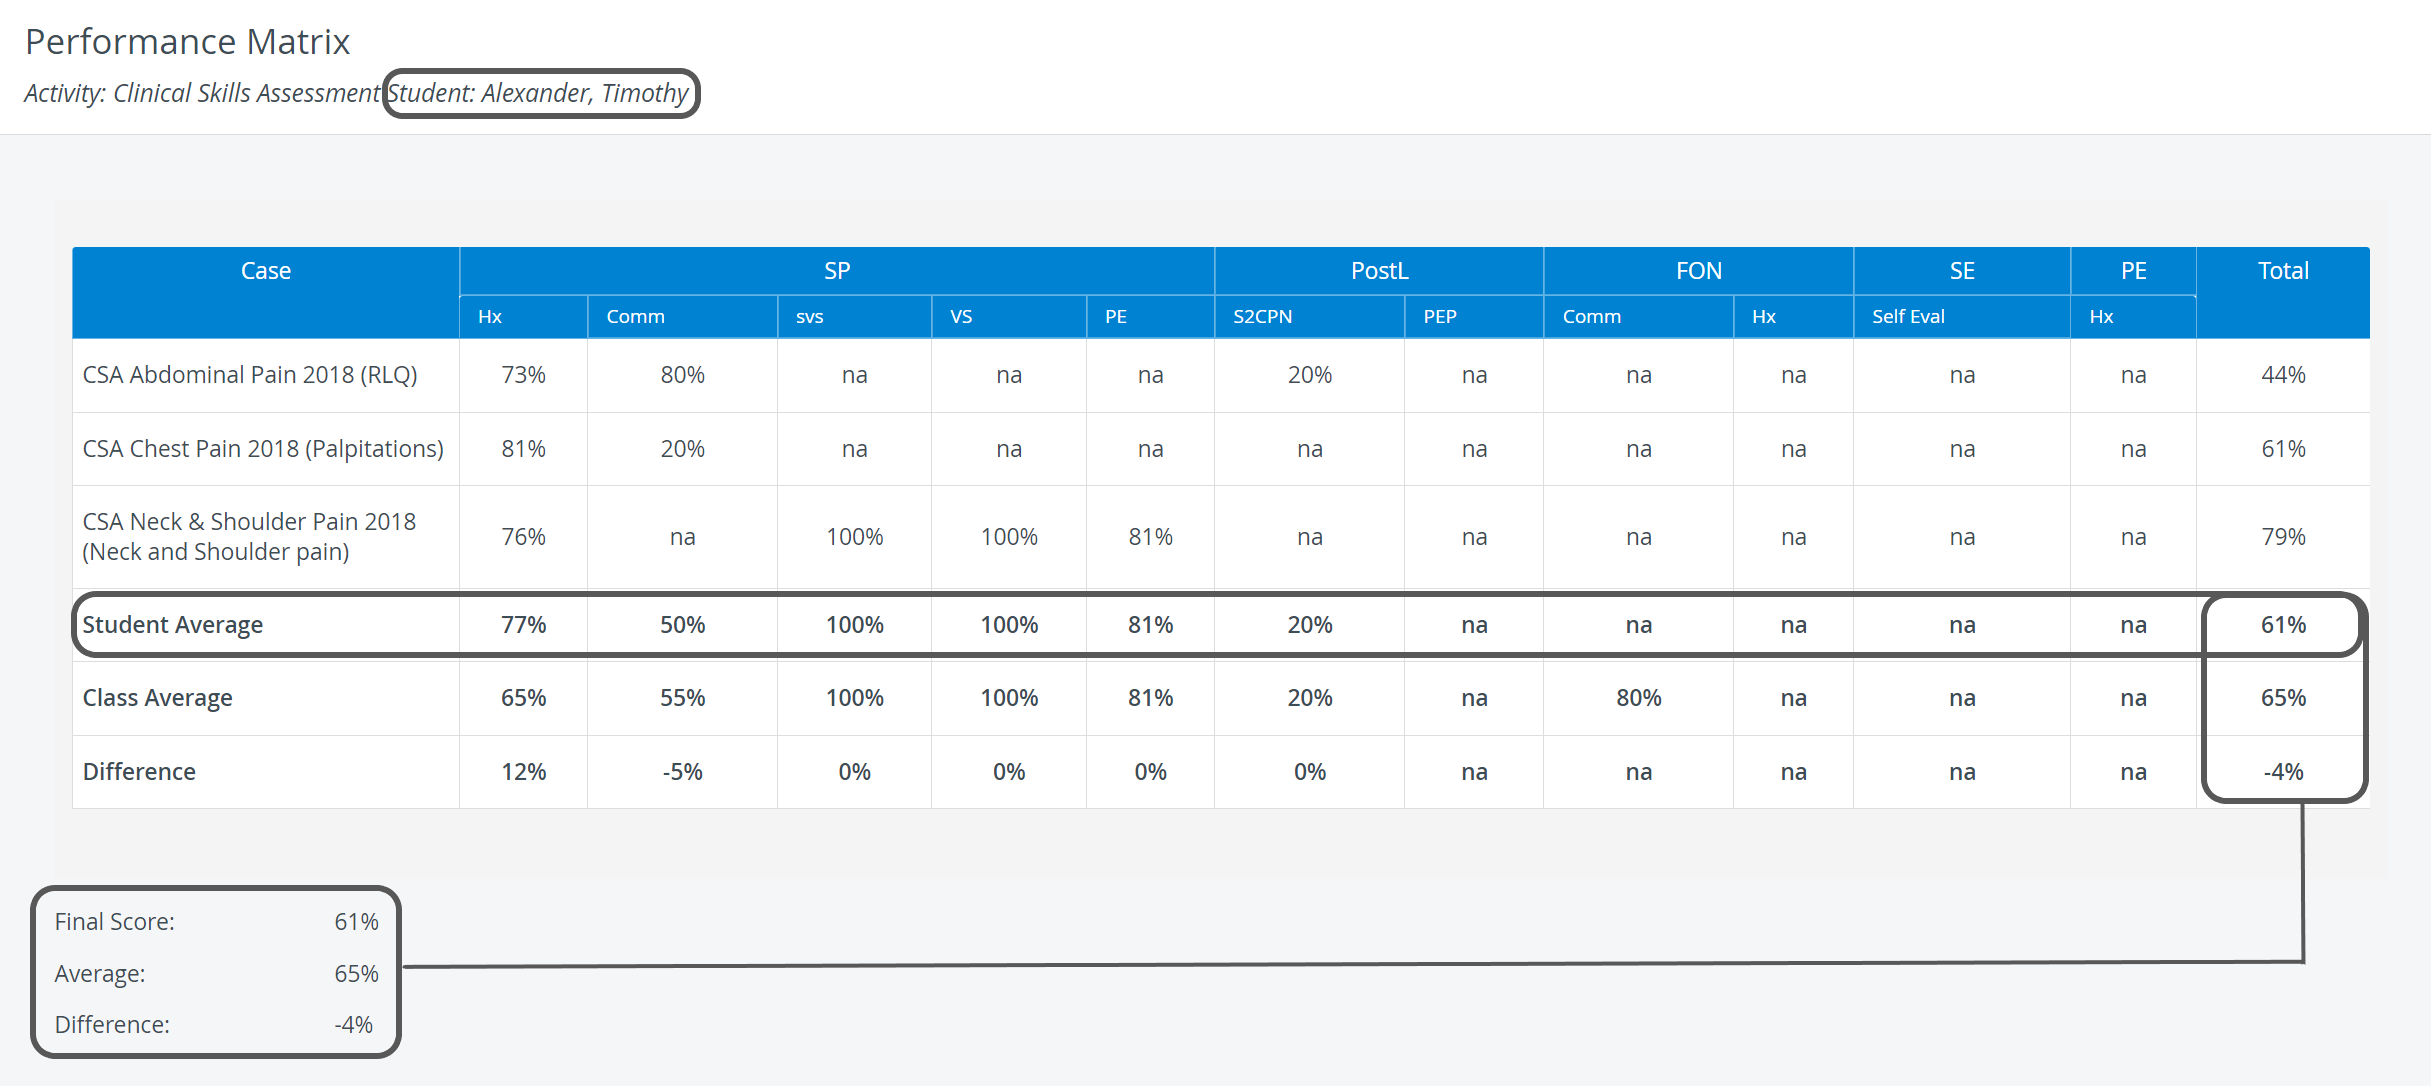
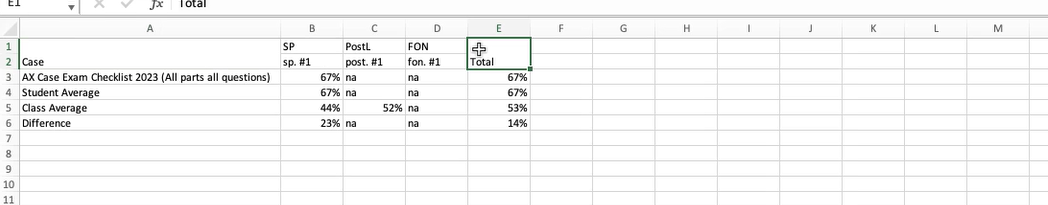
The Performance Matrix is a review of a Learner's scores for different parts (checklists) of Cases, by Section, and compare them with the class performance.
The report displays
- the selected Learner's scores or the scores for the Sections of the Cases for the entire Learner group of the Activity,
- total scores for Cases - shown in the last column of the table - either for one Learner or for the entire group,
- average scores - providing means to compare Learners' performance in a Section, a Case or the entiry Activity with the class average.
This report also displays Virtual sections (items with specific tags, creating a unit) used within a specific Case/Activity: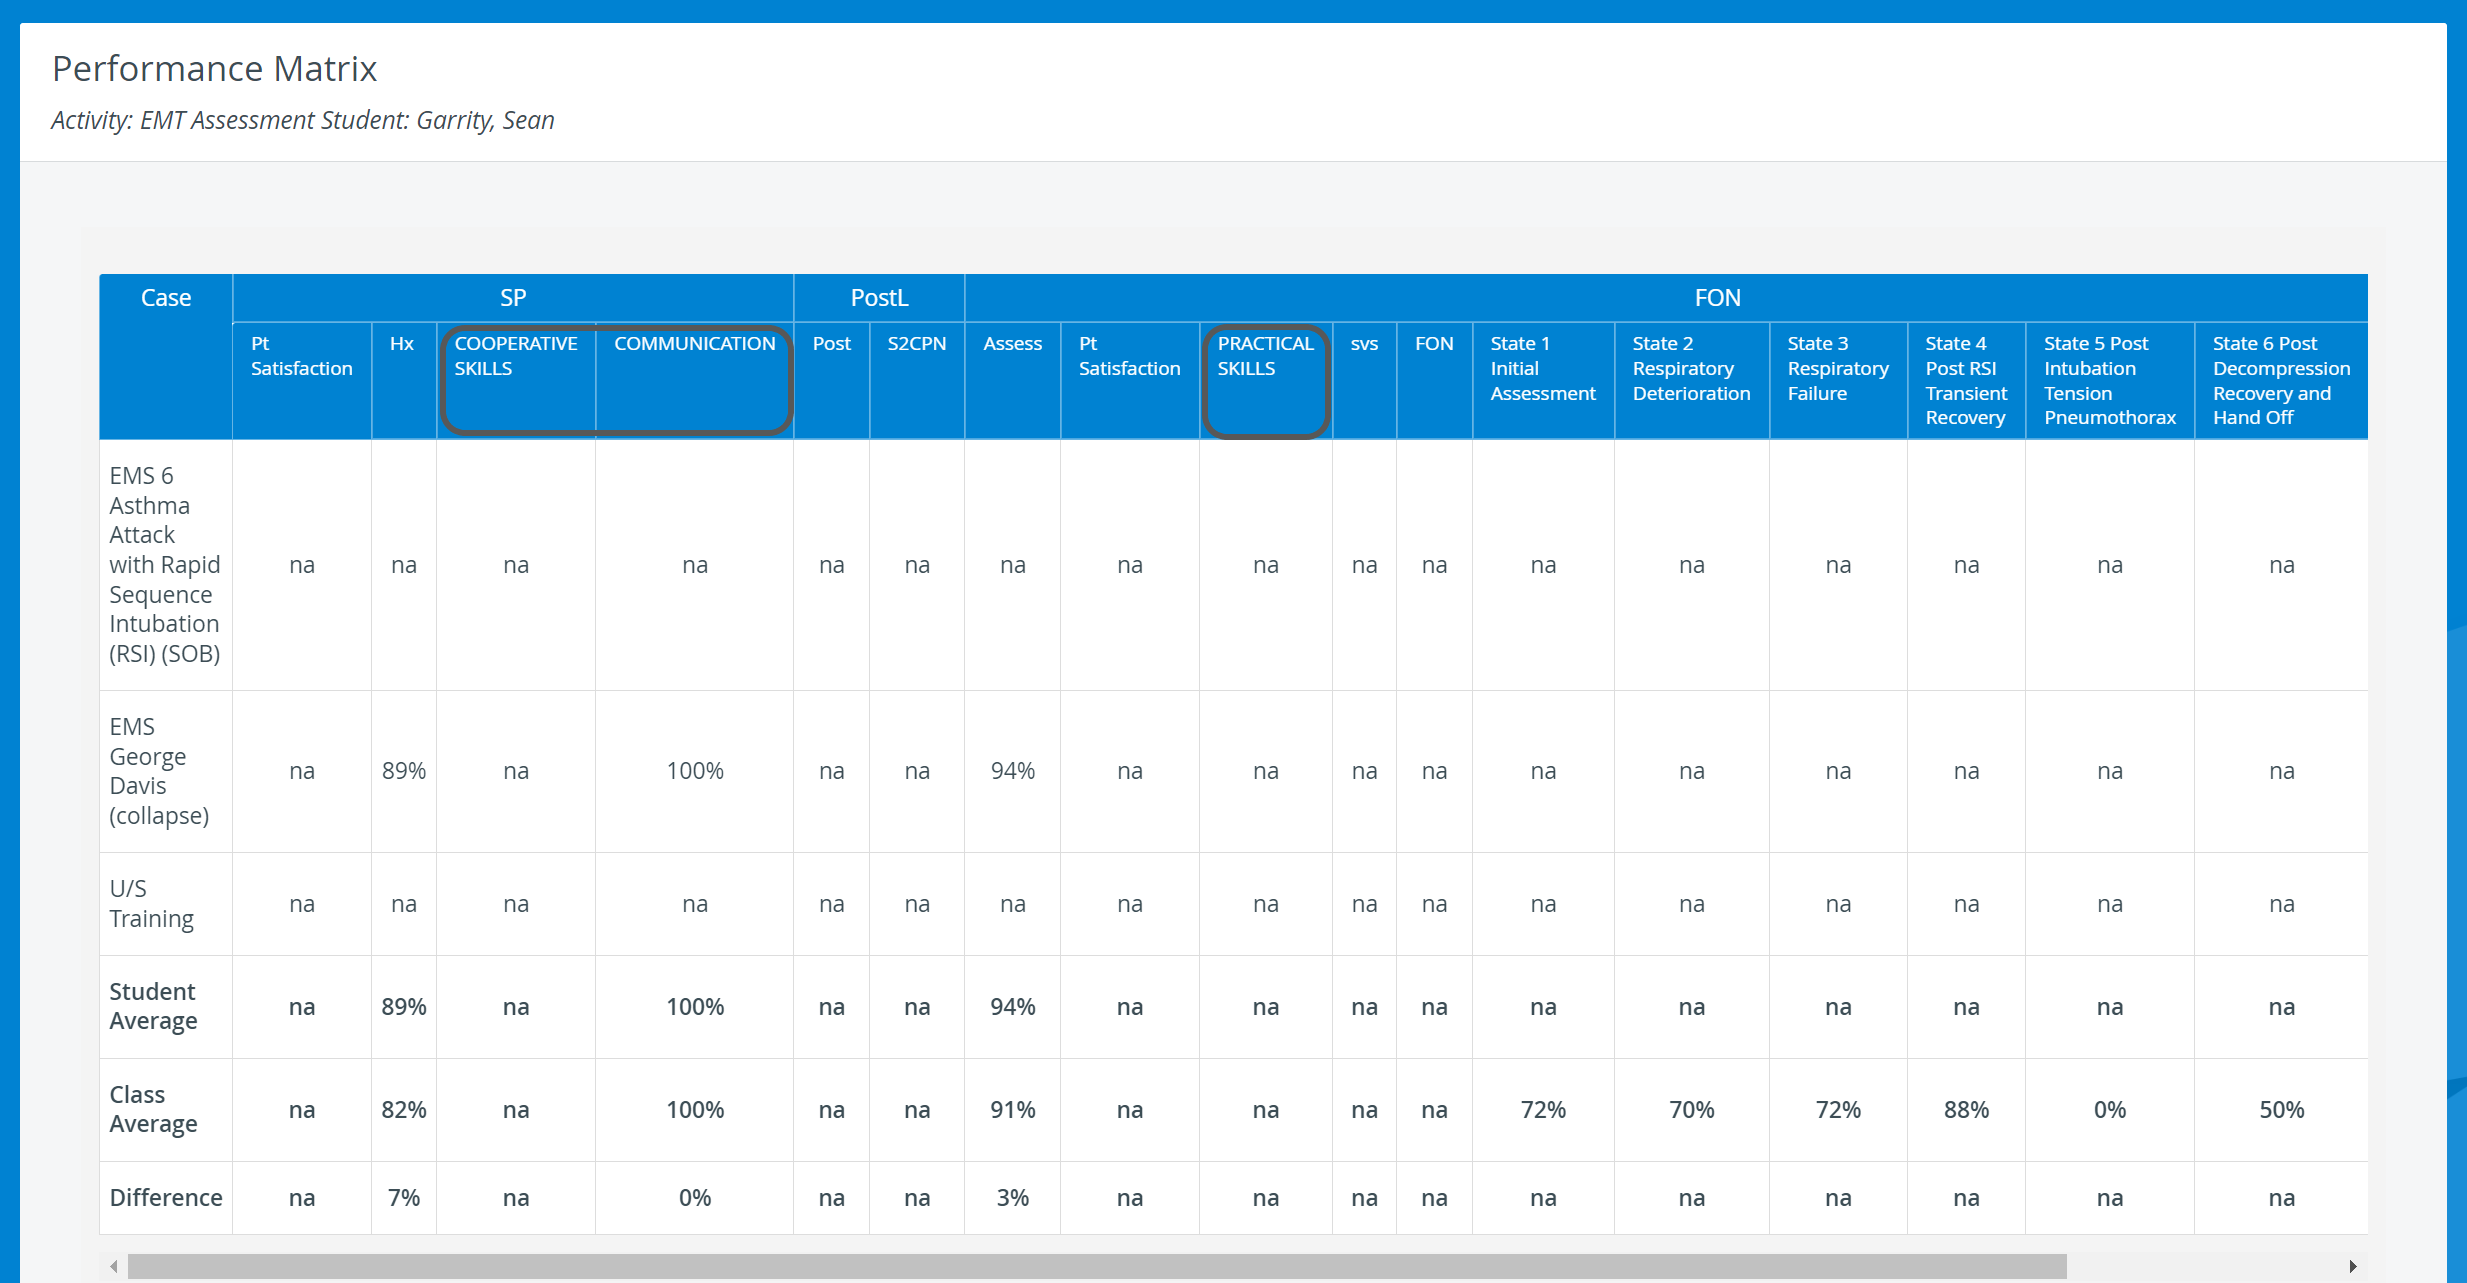
The data can also be displayed for a whole Learner group of an Activity.
The Filter to group option is only displayed if there are subgroups available within the participant group assigned to the Activity (Learner group).
However, the dropdown does not include Evaluee subgroups.
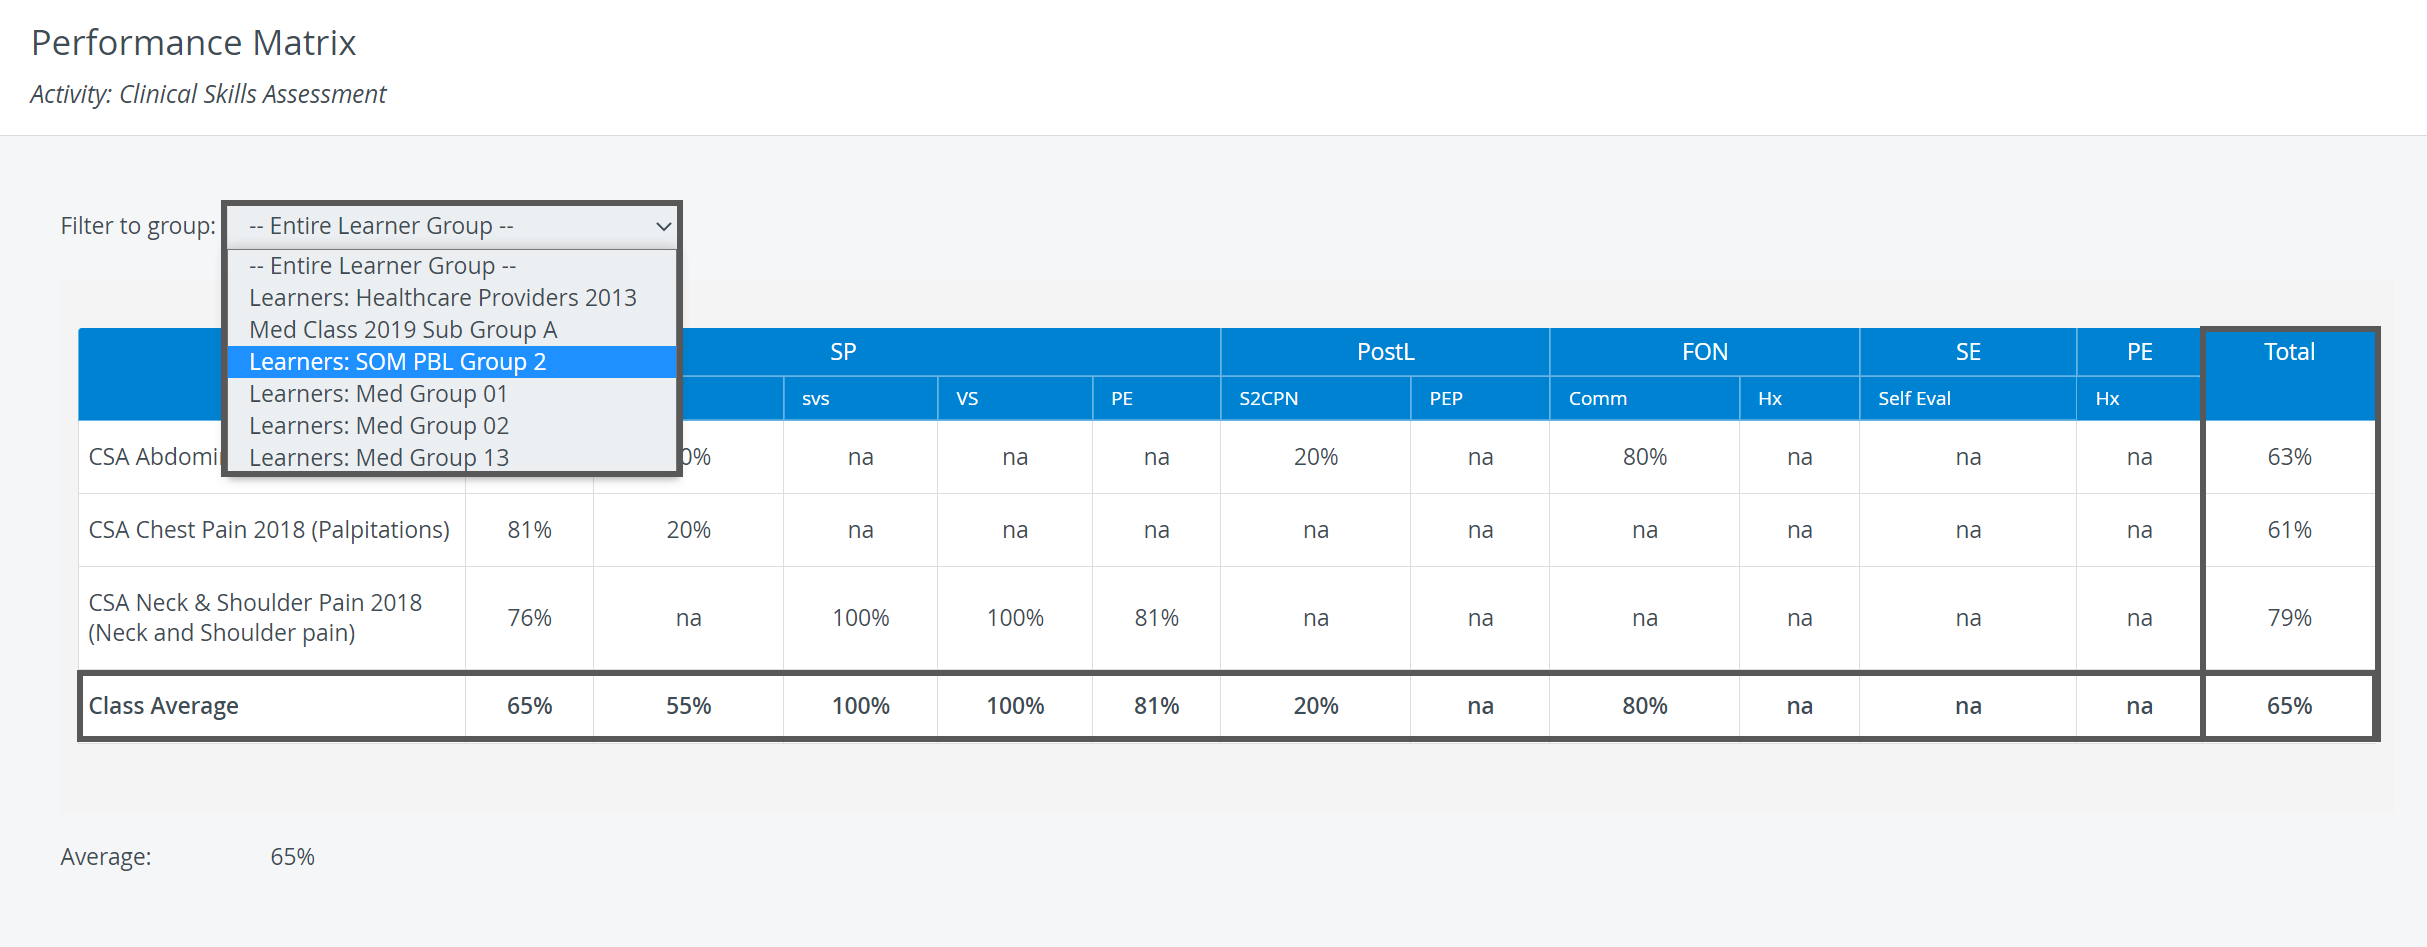
If a certain Section is not included in all the Cases assigned to the Activity, the table will contain columns for all Sections that affect scoring, but in the rows of Cases not containing a particular Section, the relevant column will contain "na" (not applicable).
Printing a Report
To print a Performance Matrix Report (either to paper or to PDF), use the Print button in the top right corner of the screen.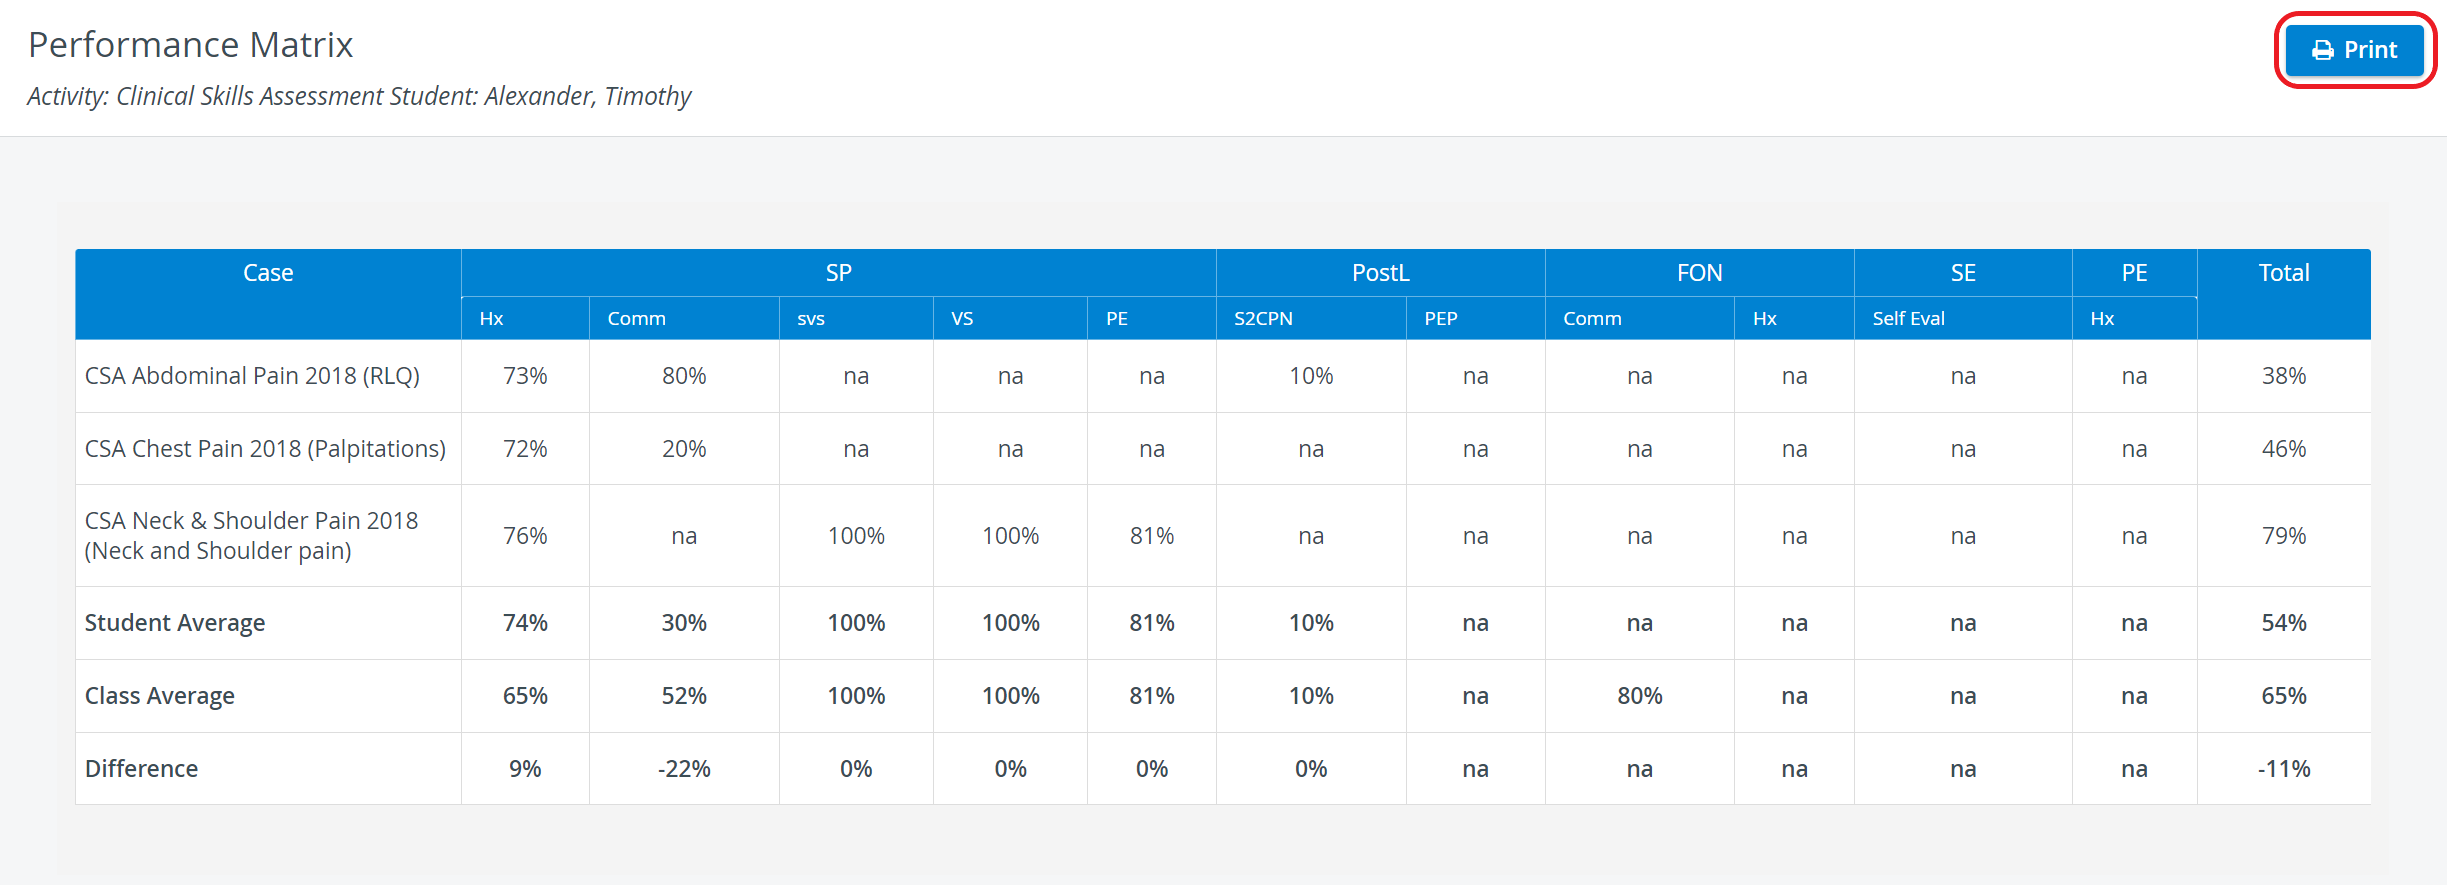
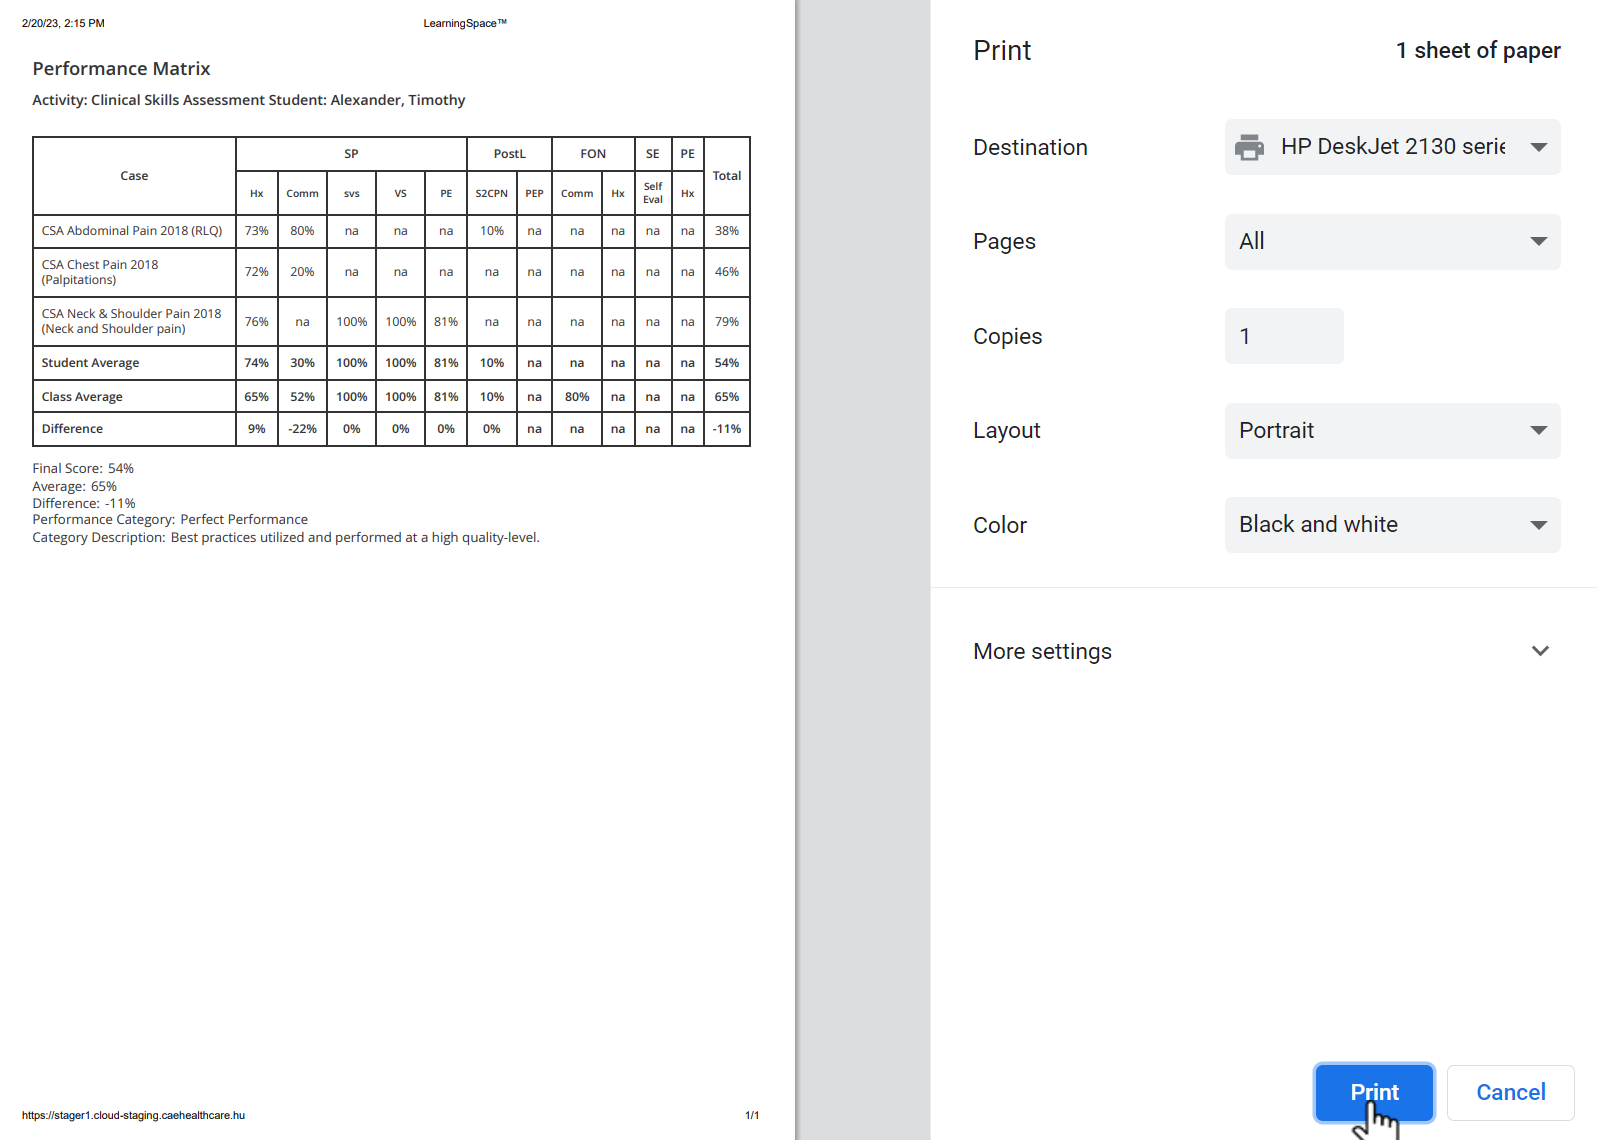
For more information go to How to Print a Report.
Export to Excel
In the latest versions of LearningSpace, reports can also be exported into an Excel (xls) file ![]() for more convenient management and an essentially easier utilization of the exported data in applications like Microsoft Excel or Google Sheets.
for more convenient management and an essentially easier utilization of the exported data in applications like Microsoft Excel or Google Sheets.
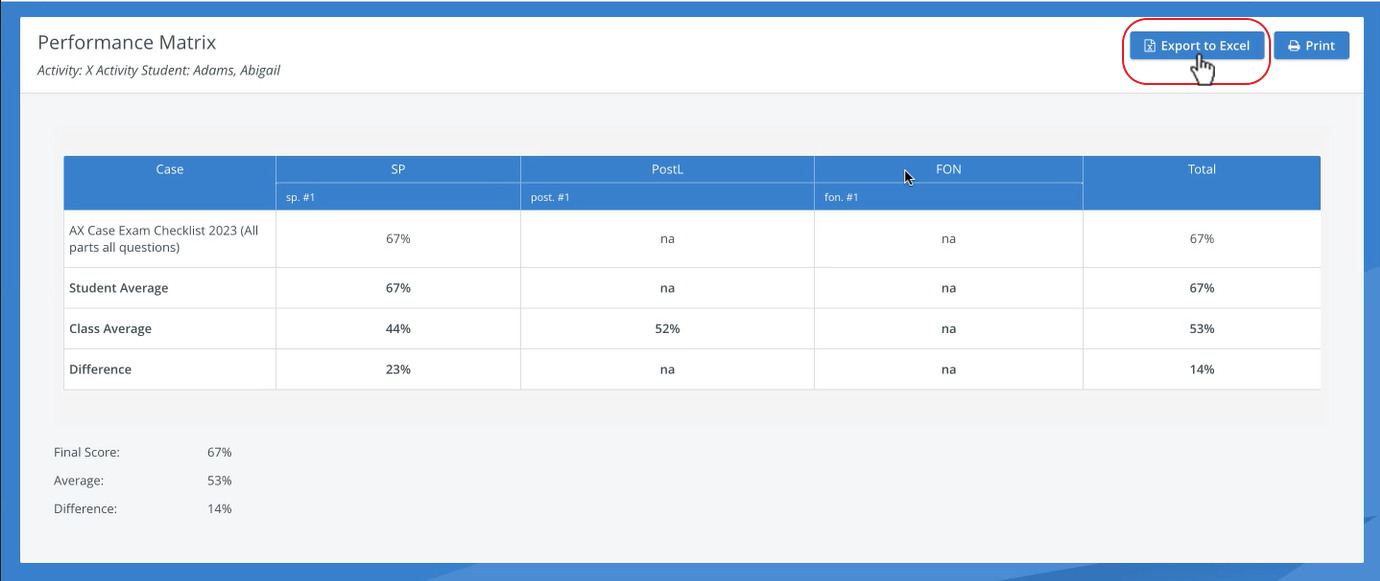
For further information, see the Reports - How to pages and the Reports Module Training Videos.
Overview
Content Tools