The Score Distribution displays the distribution of Learners' final scores as bar graphs, based on the respective settings of the Preset Reports page:
- Per Activity -- when only the Activity is selected.
- Per Case -- when the Activity and Case are selected.
The Activity and, if selected, Case names are displayed beneath the report title:
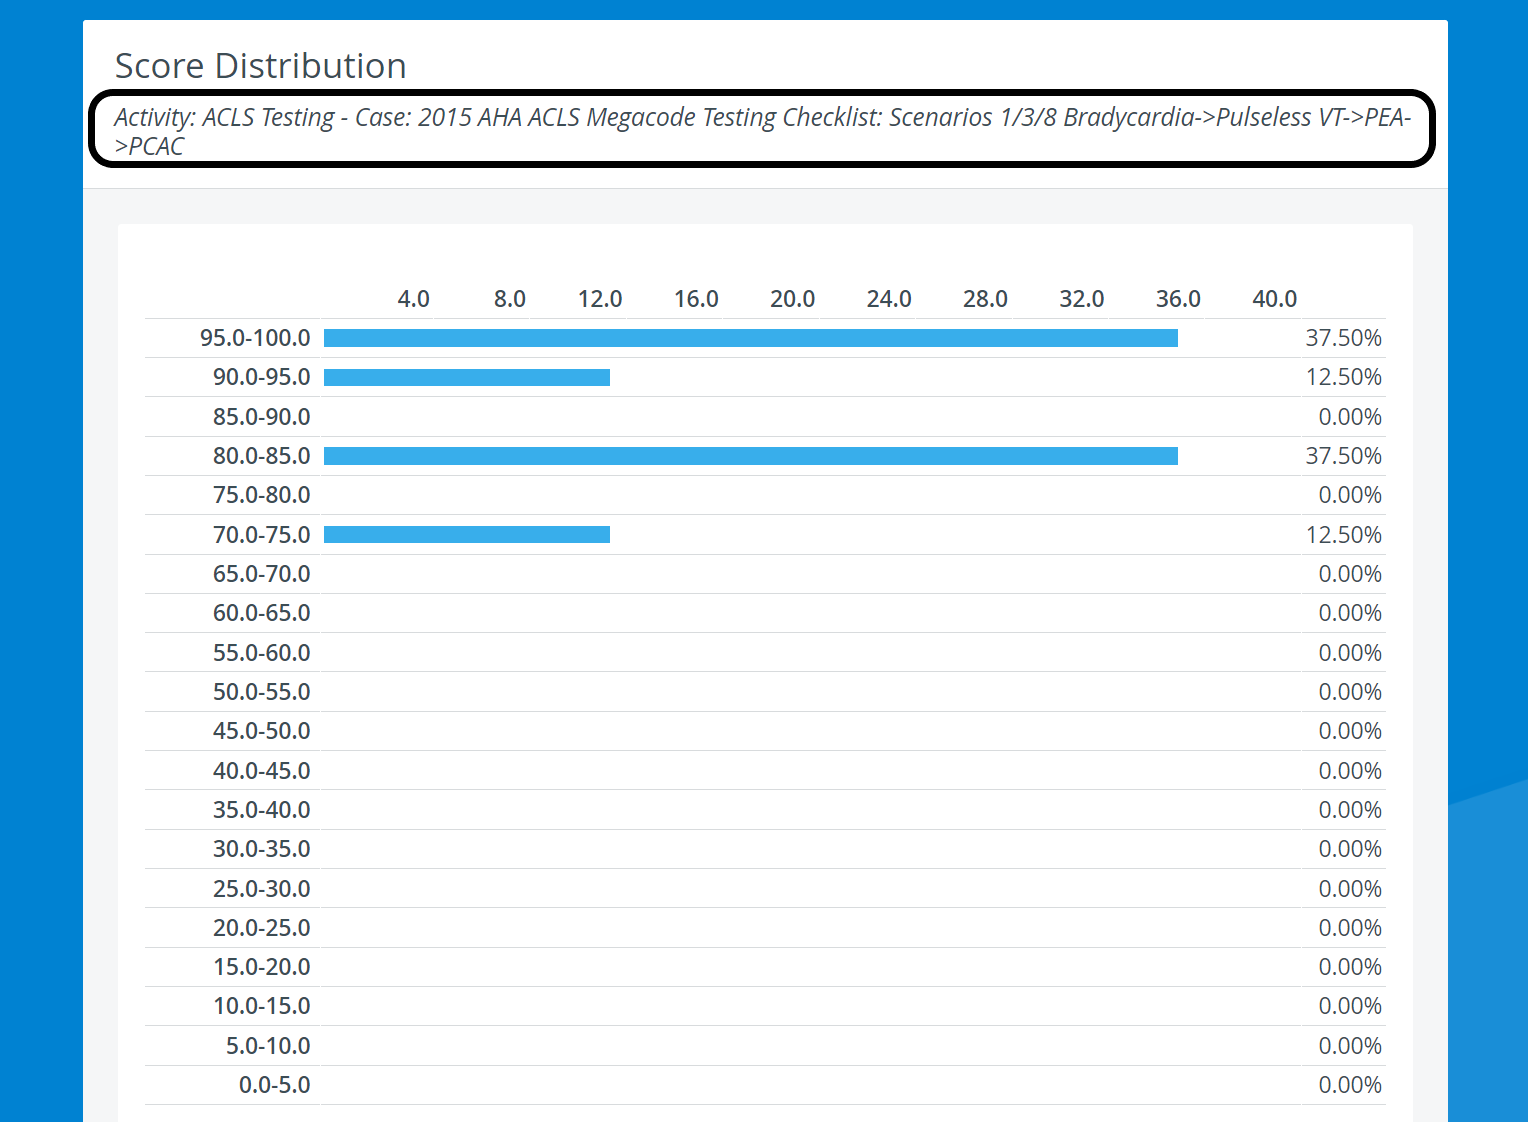
The left vertical axis of the chart shows the ranges of achievable scores from 0 to 100 (in ranges of 5).
NOTE: If responses are identified as bonus points in the Case, scores may be higher than 100.
- The horizontal axis and the bar reflect the distribution of learners who achieved the associated score.
- The right vertical axis displays the percentage (out to two decimal places) of learners who achieved a score within the indicated range.
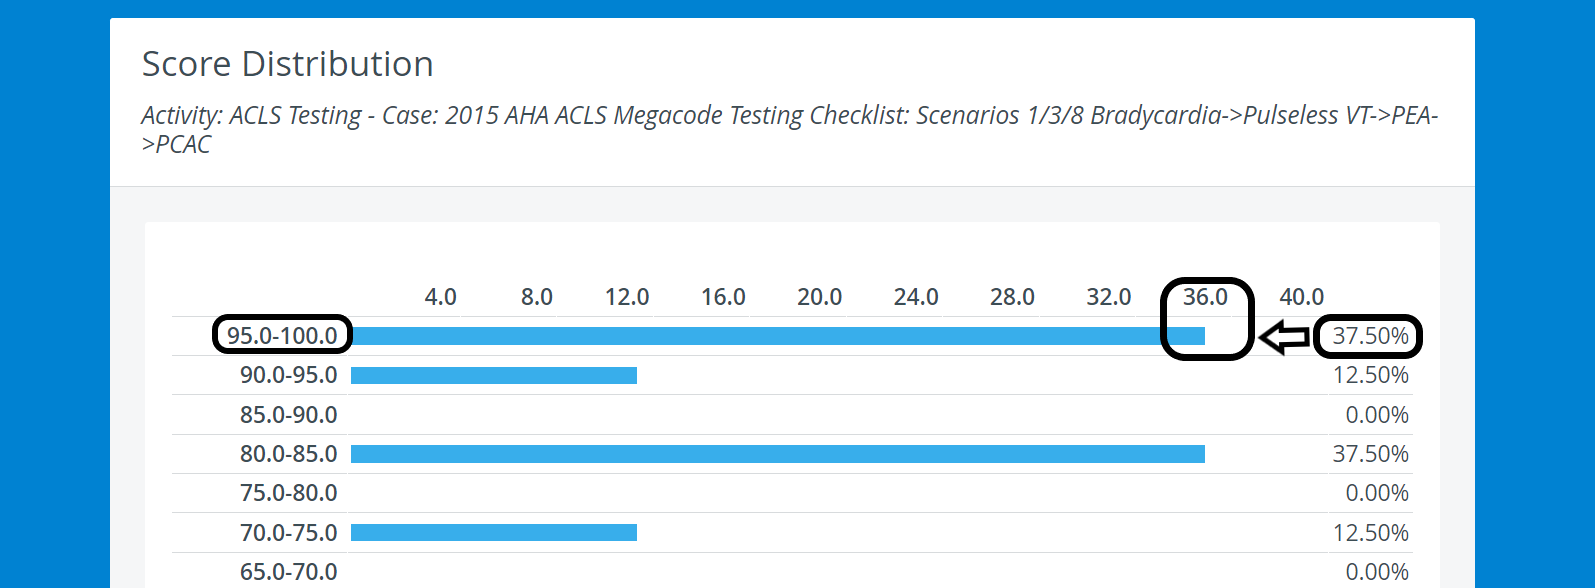
When achieveing a score at the border of an interval, it will be displayed in the range starting from that score value (i.e. 90 points won't be included in the 85-90 range but in the 90-95 range).
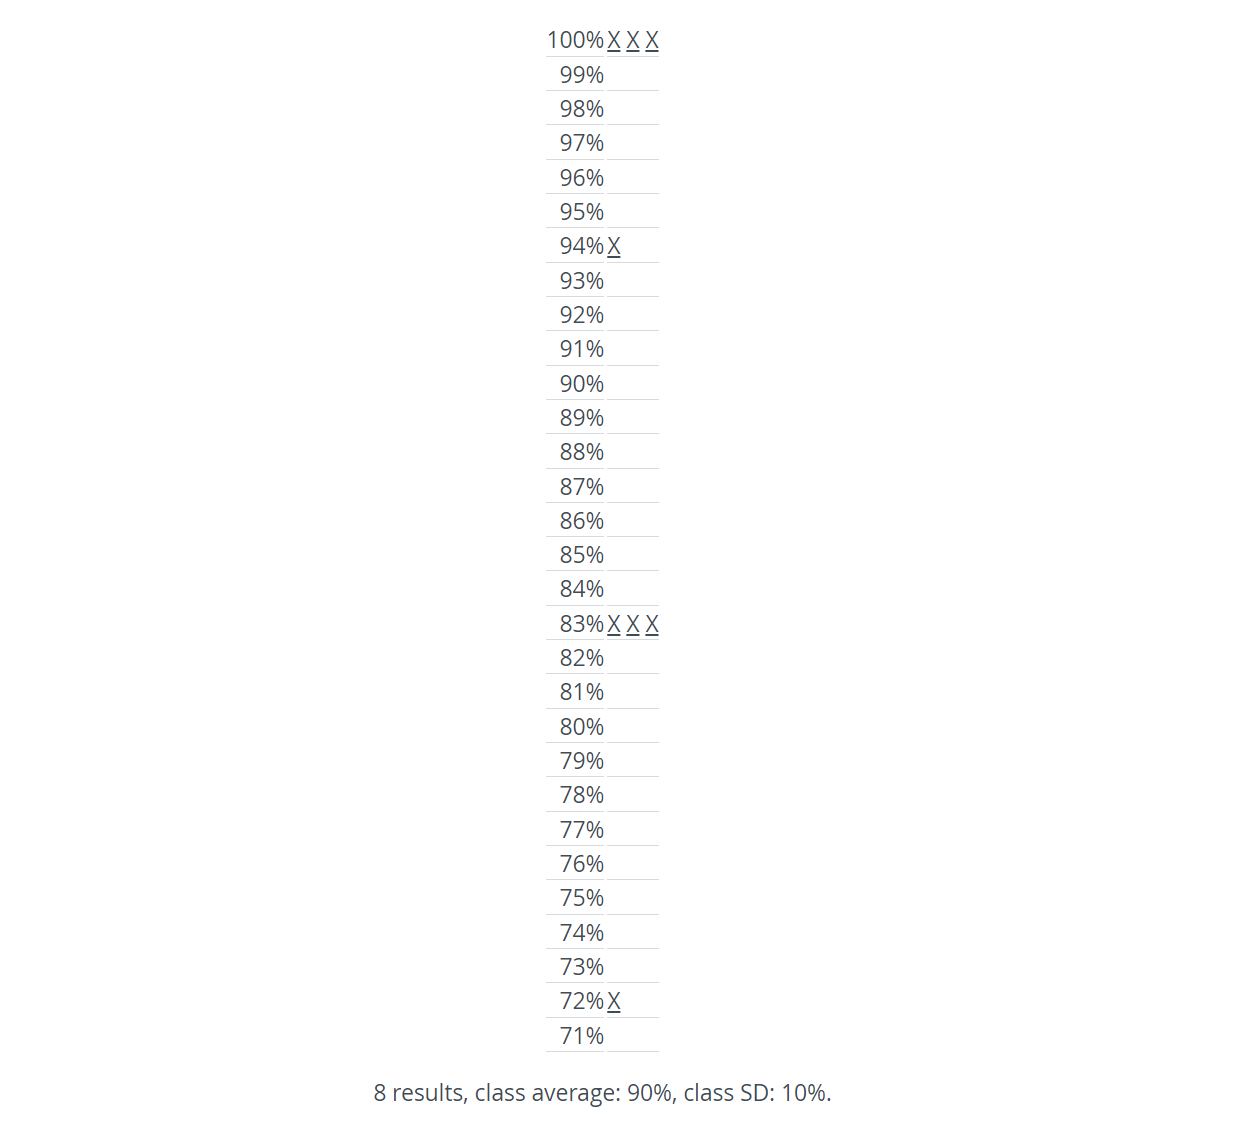
Below the chart, the achieved final scores are listed, as well as the class summary. An 'X' next to a score indicates a learner achieved that score.
Click an 'X's to navigate to the Performance Matrix for that learner.
The Score Distribution report can be made available to learners (in the Activity Report settings). However, the learners see only the Activity scores (not the per Case scores) and do not see the list of final scores.
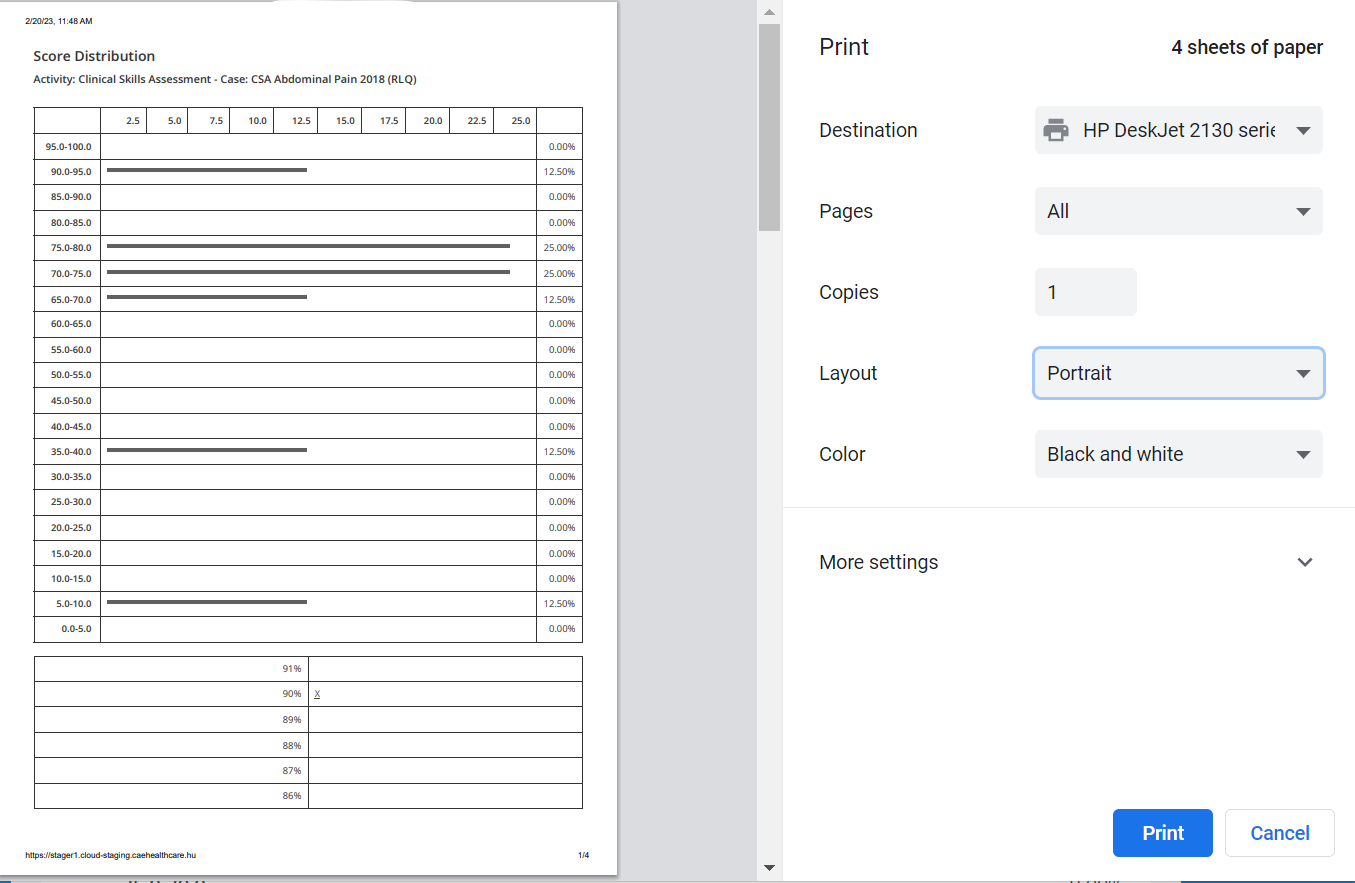
Printing a Report
To print a Score Distribution Report (either to paper or to PDF), use the Print button in the top right corner of the screen.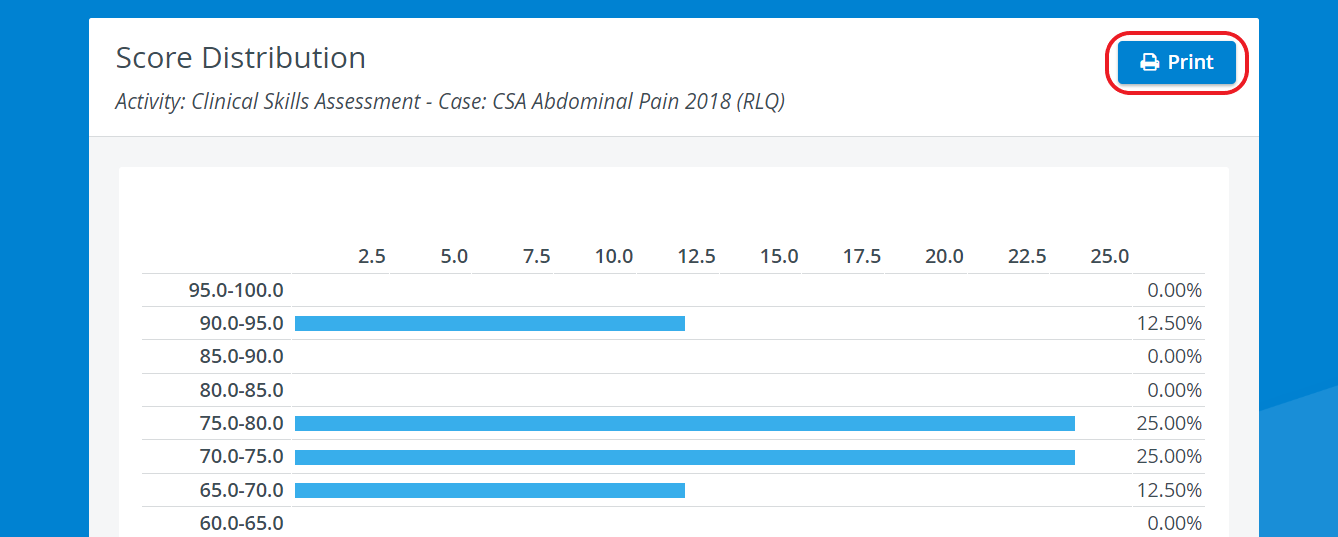
![]() For more information go to How to Print a Report.
For more information go to How to Print a Report.
Related pages
For further information, see the Reports - How to pages and the Reports Module Training Videos.
Overview
Content Tools