The Case Item Analysis report evaluates an entire Case, compares the performance of classes or subgroups.
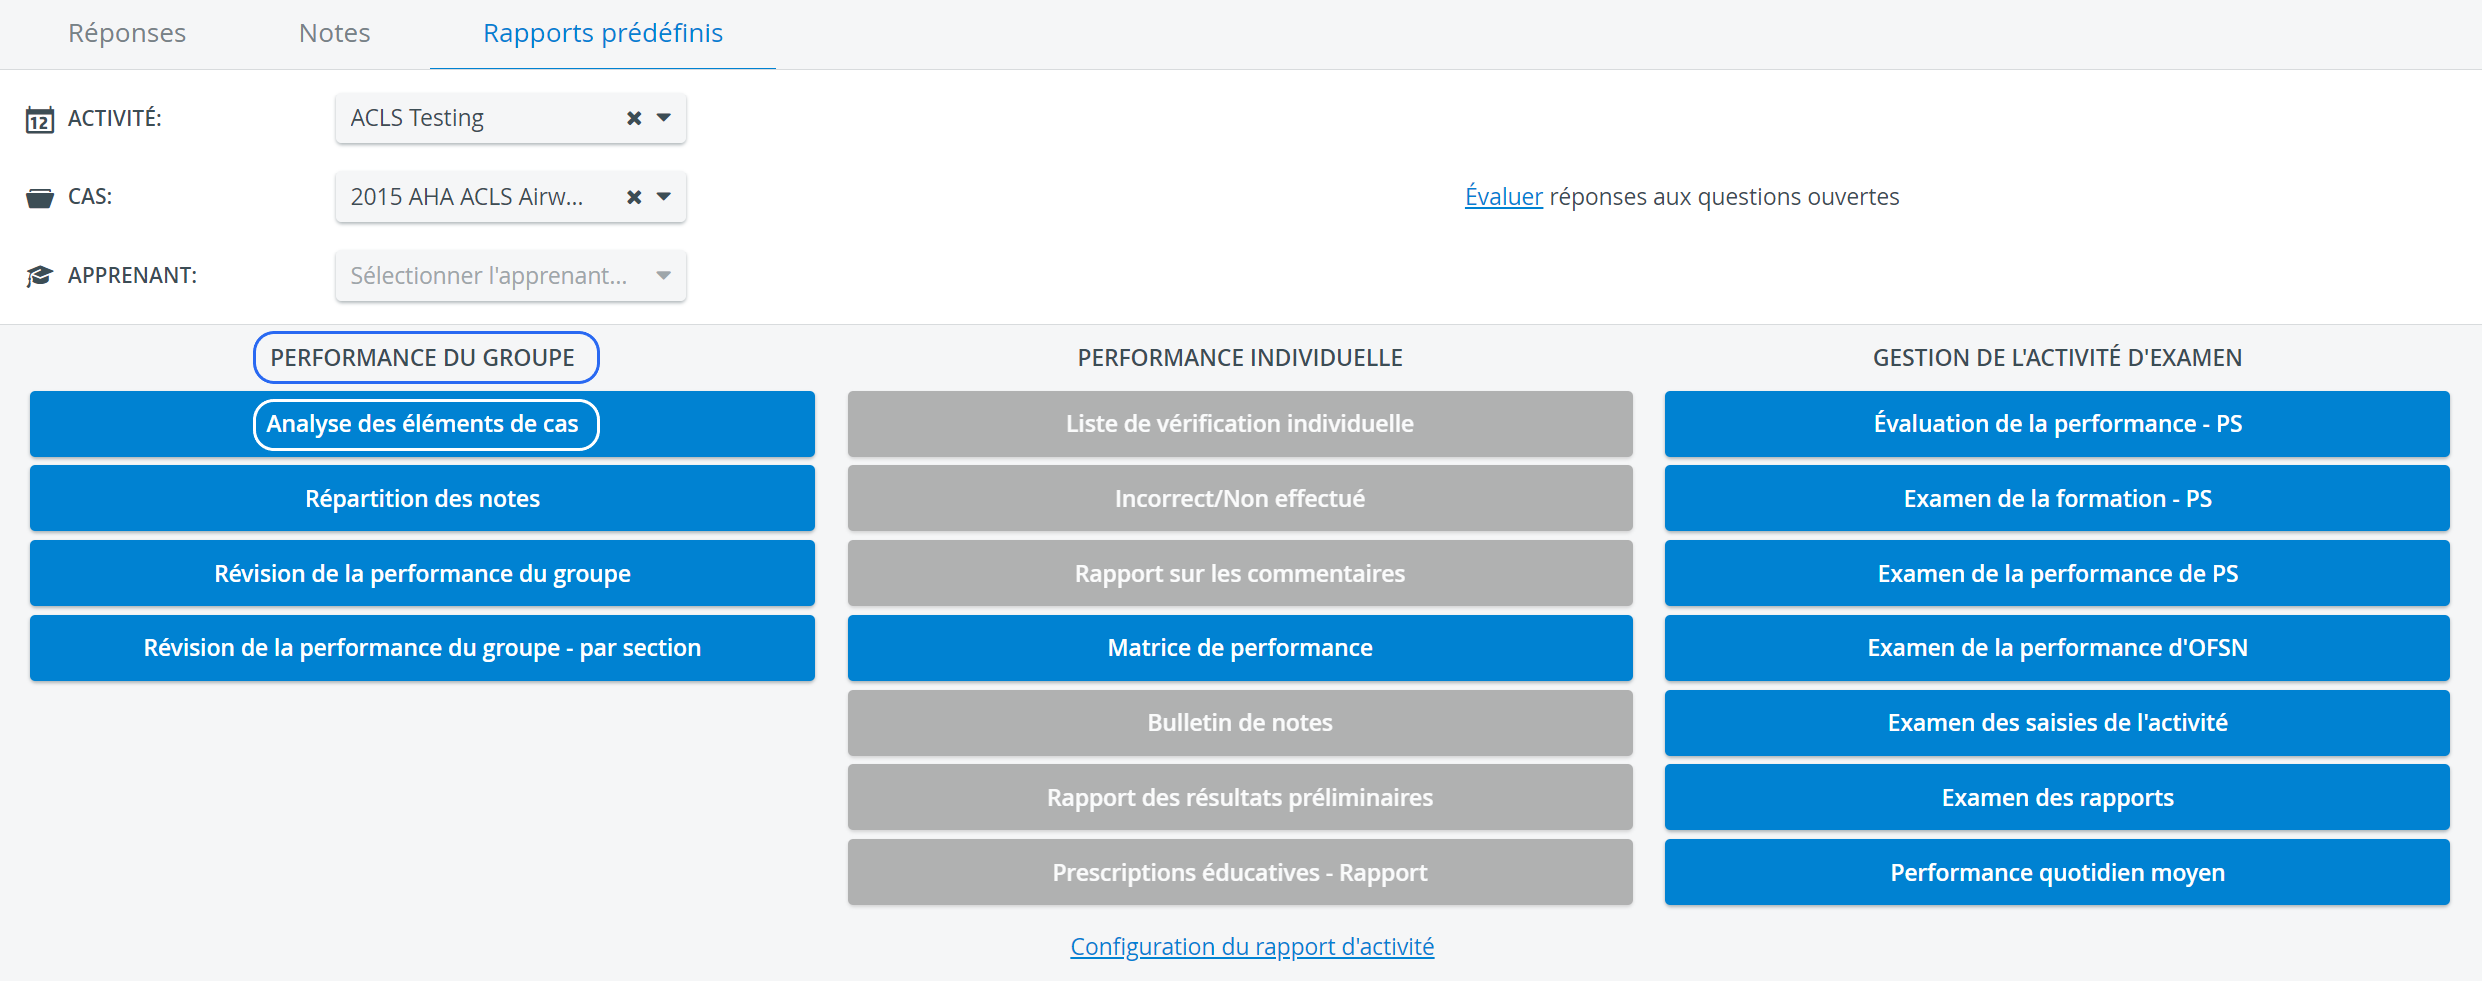
As this report is based on a Case, the Case Item Analysis button is only activated when a Case is selected from the respective drop-down on the Preset Reports tab.
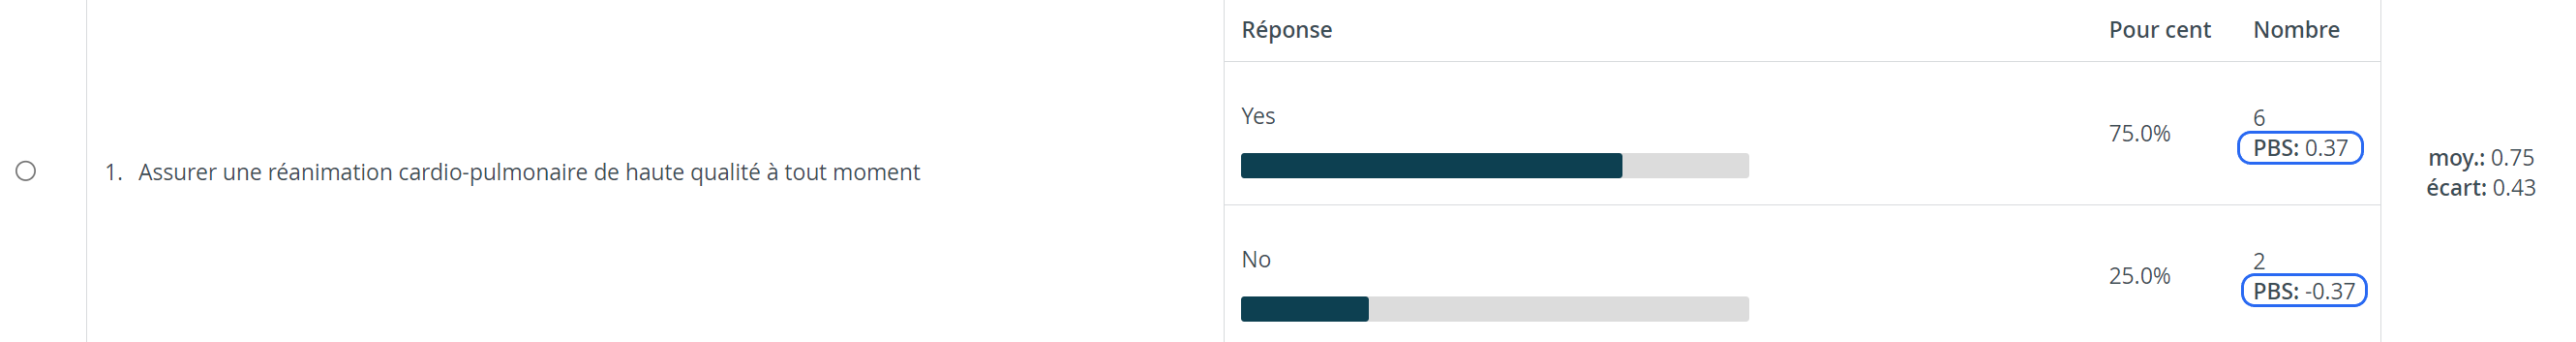
The table displays all parts/checklists of the Case, listing the items by sections. The items are listed in rows, that contain
- a radio button for selection,
- the question phrase,
- all the answer options (except for Open-ended questions where there is a link, see below)
- along with a percentage value showing the rate of learners who have selected that answer
- and the actual count of learners.
- The last column of each item-row shows the average (AVG) and standard deviation (DEV) of the point values given to the learners for that item.

The average and standard deviation are calculated for learners whose scores are actually displayed in the report, that is, if there is any filtering, it is reflected in the displayed calculations.
- Mark correct answers - by ticking the checkbox, correct answers for each item get highlighted in yellow
- Filter to group - results can be filtered for subgroups, if any available (Learner subgroups, Evaluee Subgroups).
- No dynamic subgroups - radio button selected by default.
Selecting the radio button of a specific item prompts its answer options to be displayed in a drop-down menu below the 'No dynamic subgroup' option.
Selecting a particular answer results in filtering for only those learners who submitted the selected answer for the item, or the learners for which an SP submitted the selected answer.

Depending on the relevant settings of the Report Formatting panel of the Activity Reporting Setup, the Case Item Analysis report may include the point biserial values (PBS) which helps evaluate the pertinence and efficiency of a question (item) or the selection rates of answers. The PBS - if set - is displayed below the count of learners who selected a particular answer.

View textual answers link - link in the answer column of open-ended questions

Clicking the link navigates to the Textual Answers page where all the texts submitted by or for learners are displayed by their names, indicating the time and date of data entry, as well as the score (if OEQS has been concluded).

The More option is displayed at an item if additional information has been added to the question in Case manager.

Setup in the Case content editor:

Show diagrams - with this option enabled, statistical data can be displayed in a more visualized way:
Printing the Report
To print a Case Item Analysis Report (either to paper or to PDF), use the Print button in the top right corner of the screen.

For printing Histograms (diagrams), the Background graphics option has to be enabled in the Print preview window (More settings > Options).

![]() For more information go to How to Print a Report.
For more information go to How to Print a Report.
For further information, see the Reports - How to pages and the Reports Module Training Videos.
Overview
Content Tools